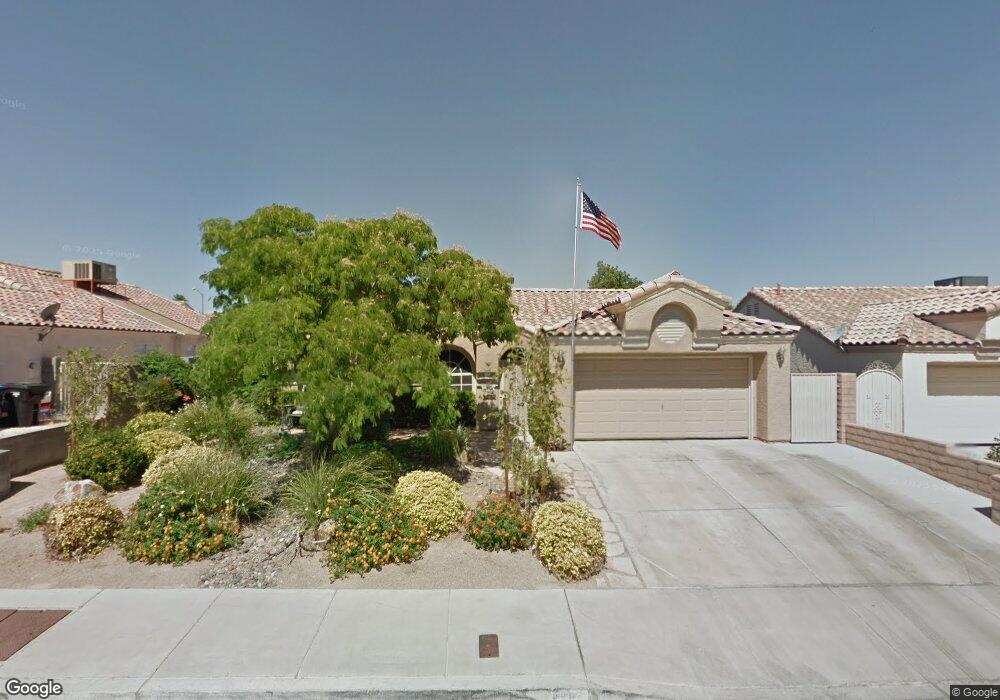
848 Butch Cassidy Ln Henderson, NV 89002
Highland Hills NeighborhoodEstimated Value: $373,000 - $390,000
3
Beds
2
Baths
1,243
Sq Ft
$306/Sq Ft
Est. Value
About This Home
This home is located at 848 Butch Cassidy Ln, Henderson, NV 89002 and is currently estimated at $380,535, approximately $306 per square foot. 848 Butch Cassidy Ln is a home located in Clark County with nearby schools including Fay Galloway Elementary School, Jack & Terry Mannion Middle School, and Foothill High School.
Ownership History
Date
Name
Owned For
Owner Type
Purchase Details
Closed on
Nov 19, 2021
Sold by
Weakland Lisa M
Bought by
Weakland Lisa M and Lisa M Weakland Living Trust
Current Estimated Value
Purchase Details
Closed on
Jan 13, 2003
Sold by
Weakland Lisa M and Long Lisa M
Bought by
Weakland David L and Weakland Lisa M
Home Financials for this Owner
Home Financials are based on the most recent Mortgage that was taken out on this home.
Original Mortgage
$108,800
Outstanding Balance
$45,151
Interest Rate
6.15%
Estimated Equity
$335,384
Purchase Details
Closed on
Mar 30, 1998
Sold by
Cox Christian C
Bought by
Long Lisa M
Home Financials for this Owner
Home Financials are based on the most recent Mortgage that was taken out on this home.
Original Mortgage
$112,628
Interest Rate
7.06%
Mortgage Type
FHA
Purchase Details
Closed on
Mar 26, 1998
Sold by
Rodriguez Claudia C
Bought by
Cox Christian C
Home Financials for this Owner
Home Financials are based on the most recent Mortgage that was taken out on this home.
Original Mortgage
$112,628
Interest Rate
7.06%
Mortgage Type
FHA
Create a Home Valuation Report for This Property
The Home Valuation Report is an in-depth analysis detailing your home's value as well as a comparison with similar homes in the area
Home Values in the Area
Average Home Value in this Area
Purchase History
| Date | Buyer | Sale Price | Title Company |
|---|---|---|---|
| Weakland Lisa M | -- | None Available | |
| Weakland David L | -- | Pioneer National Title | |
| Long Lisa M | $114,000 | First American Title Co | |
| Cox Christian C | -- | First American Title Co |
Source: Public Records
Mortgage History
| Date | Status | Borrower | Loan Amount |
|---|---|---|---|
| Open | Weakland David L | $108,800 | |
| Closed | Long Lisa M | $112,628 |
Source: Public Records
Tax History
| Year | Tax Paid | Tax Assessment Tax Assessment Total Assessment is a certain percentage of the fair market value that is determined by local assessors to be the total taxable value of land and additions on the property. | Land | Improvement |
|---|---|---|---|---|
| 2026 | $1,354 | $76,425 | $34,300 | $42,125 |
| 2025 | $1,314 | $70,092 | $26,950 | $43,142 |
| 2024 | $1,277 | $70,092 | $26,950 | $43,142 |
| 2023 | $1,277 | $75,224 | $33,950 | $41,274 |
| 2022 | $1,300 | $65,255 | $27,300 | $37,955 |
| 2021 | $1,204 | $58,993 | $22,750 | $36,243 |
| 2020 | $1,166 | $58,518 | $22,400 | $36,118 |
| 2019 | $1,132 | $55,709 | $19,950 | $35,759 |
| 2018 | $1,099 | $51,082 | $16,450 | $34,632 |
| 2017 | $1,448 | $49,939 | $14,700 | $35,239 |
| 2016 | $1,041 | $44,285 | $8,750 | $35,535 |
| 2015 | $1,038 | $37,624 | $8,750 | $28,874 |
| 2014 | $1,008 | $34,003 | $7,350 | $26,653 |
Source: Public Records
Map
Nearby Homes
- 828 Singing Drum Dr
- 915 High Plains Dr
- 940 Rifle Dr
- 836 Cherry Dr
- 812 Arrowhead Trail
- 630 Bighorn Creek St
- 1007 Winding Hill St
- 599 Marsh Creek Ct Unit 3A
- 718 Bighorn Creek St
- 0 College Dr
- 984 Mackenzie Creek Ave
- Plan 1644 at Caspian Bay - Reserves
- Plan 1901 Modeled at Caspian Bay - Reserves
- Plan 1849 at Caspian Bay - Reserves
- Plan 2469 at Caspian Bay - Reserves
- Plan 3066 Modeled at Caspian Bay - Reserves
- Plan 2242 at Caspian Bay - Reserves
- 918 Calamity Jane Ln
- 664 Tranquil Bay Ct
- 713 Strawberry Place
- 850 Butch Cassidy Ln Unit none
- 850 Butch Cassidy Ln
- 846 Butch Cassidy Ln
- 847 Brahma Ln
- 845 Brahma Ln
- 849 Brahma Ln
- 852 Butch Cassidy Ln
- 844 Butch Cassidy Ln
- 843 Brahma Ln
- 910 Saddle Horn Dr
- 911 Saddle Horn Dr
- 842 Butch Cassidy Ln
- 854 Butch Cassidy Ln
- 841 Brahma Ln
- 853 Brahma Ln
- 912 Saddle Horn Dr
- 913 Saddle Horn Dr
- 910 Stetson Dr
- 840 Butch Cassidy Ln
- 848 Brahma Ln
Your Personal Tour Guide
Ask me questions while you tour the home.