
Seller's Agent in 2025
Paula Seitchik
BHHS Fox & Roach
(215) 740-2921
6 in this area
42 Total Sales
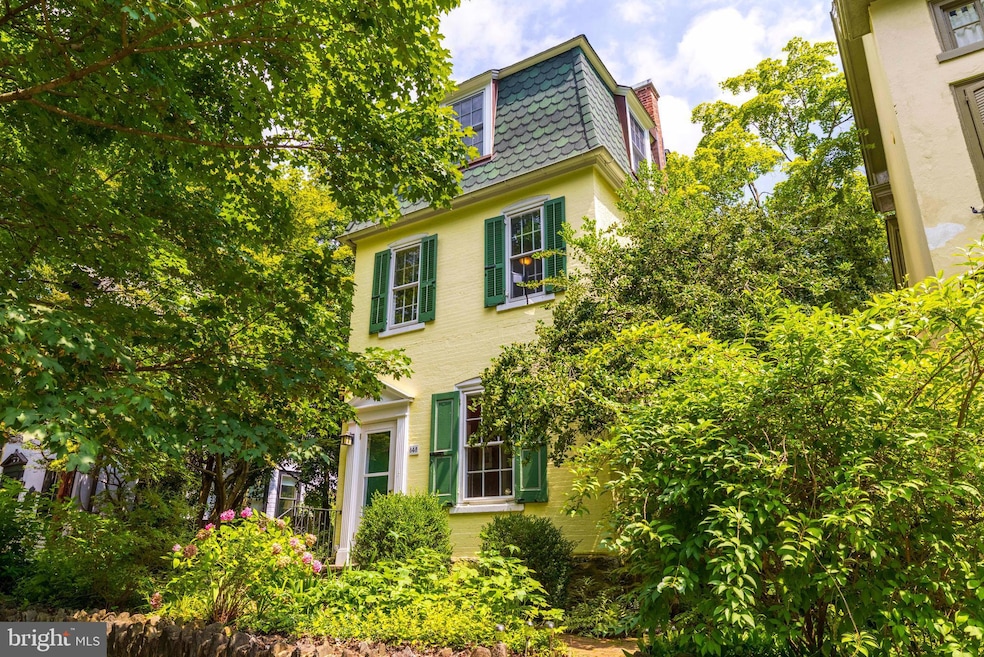


Old world charm, modern amenities, and stellar location come together in this fabulous farm house. From its perch just above street level, this home has much to offer. The first floor includes a tiled entry area, open living room with bow window, separate dining room with built-in china cabinet, and wonderful cooks kitchen with maple cabinets, granite counters, stainless steel appliances, and sliding doors to the back yard. On the second level you will find a spacious main bedroom with vaulted ceiling and dressing area, second nice sized bedroom, third bedroom with build in book shelves, and hall bath with claw food tub. An addition three bedrooms and bath on the third floor round out this homes generous amount of living space. The rear yard is serene and has plenty of space for gardening , playing, and entertaining. The location can't be beat...A few blocks to Weavers Way Coop, High Point coffee, Carpeneter's woods, the trails of the wissahickon, and easy access to both train and bus.
| Date | Type | Sale Price | Title Company |
|---|---|---|---|
| Deed | $855,000 | Northwest Abstract | |
| Interfamily Deed Transfer | -- | None Available | |
| Deed | $425,000 | None Available | |
| Deed | $460,500 | -- | |
| Deed | $265,000 | -- |
| Date | Status | Loan Amount | Loan Type |
|---|---|---|---|
| Previous Owner | $290,000 | New Conventional | |
| Previous Owner | $100,000 | Credit Line Revolving | |
| Previous Owner | $10,100 | Unknown | |
| Previous Owner | $230,000 | Fannie Mae Freddie Mac |
| Date | Event | Price | Change | Sq Ft Price |
|---|---|---|---|---|
| 08/12/2025 08/12/25 | Sold | $855,000 | -1.2% | $360 / Sq Ft |
| 07/31/2025 07/31/25 | Pending | -- | -- | -- |
| 07/25/2025 07/25/25 | For Sale | $865,000 | -- | $364 / Sq Ft |
| Year | Tax Paid | Tax Assessment Tax Assessment Total Assessment is a certain percentage of the fair market value that is determined by local assessors to be the total taxable value of land and additions on the property. | Land | Improvement |
|---|---|---|---|---|
| 2025 | $6,890 | $583,400 | $116,680 | $466,720 |
| 2024 | $6,890 | $583,400 | $116,680 | $466,720 |
| 2023 | $6,890 | $492,200 | $98,440 | $393,760 |
| 2022 | $4,667 | $447,200 | $98,440 | $348,760 |
| 2021 | $5,297 | $0 | $0 | $0 |
| 2020 | $5,297 | $0 | $0 | $0 |
| 2019 | $5,529 | $0 | $0 | $0 |
| 2018 | $4,334 | $0 | $0 | $0 |
| 2017 | $4,754 | $0 | $0 | $0 |
| 2016 | $4,334 | $0 | $0 | $0 |
| 2015 | $4,149 | $0 | $0 | $0 |
| 2014 | -- | $339,600 | $97,317 | $242,283 |
| 2012 | -- | $66,208 | $12,463 | $53,745 |
Seller's Agent in 2025
Paula Seitchik
BHHS Fox & Roach
(215) 740-2921
6 in this area
42 Total Sales
Buyer's Agent in 2025
Louise D'Alessandro
Elfant Wissahickon-Chestnut Hill
(215) 852-9312
9 in this area
94 Total Sales
Source: Bright MLS
MLS Number: PAPH2509454
APN: 223112700
Disclaimer: Certain information contained herein is derived from information provided by parties other than Homes.com. All information provided is deemed reliable, but is not guaranteed to be accurate and should be independently verified.
![]() The data relating to real estate for sale on this website appears in part through the BRIGHT Internet Data Exchange program, a voluntary cooperative exchange of property listing data between licensed real estate brokerage firms, and is provided by BRIGHT through a licensing agreement.
The data relating to real estate for sale on this website appears in part through the BRIGHT Internet Data Exchange program, a voluntary cooperative exchange of property listing data between licensed real estate brokerage firms, and is provided by BRIGHT through a licensing agreement.
Listing information is from various brokers who participate in the Bright MLS IDX program and not all listings may be visible on the site.
The property information being provided on or through the website is for the personal, non-commercial use of consumers and such information may not be used for any purpose other than to identify prospective properties consumers may be interested in purchasing.
Some properties which appear for sale on the website may no longer be available because they are for instance, under contract, sold or are no longer being offered for sale.
Property information displayed is deemed reliable but is not guaranteed.
Copyright 2025 Bright MLS, Inc.