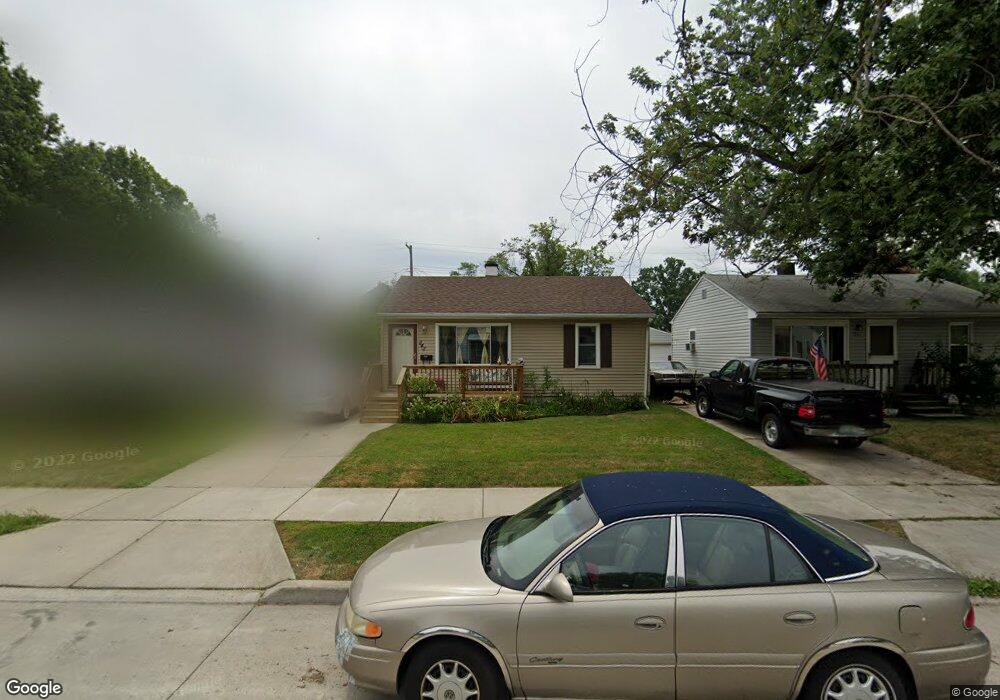
848 E Barrett Ave Madison Heights, MI 48071
Estimated Value: $135,049 - $153,000
2
Beds
3
Baths
804
Sq Ft
$182/Sq Ft
Est. Value
About This Home
This home is located at 848 E Barrett Ave, Madison Heights, MI 48071 and is currently estimated at $146,012, approximately $181 per square foot. 848 E Barrett Ave is a home located in Oakland County with nearby schools including Madison High School and Calvary Christian School.
Ownership History
Date
Name
Owned For
Owner Type
Purchase Details
Closed on
Sep 7, 2016
Sold by
Agc Properties Inc
Bought by
Linegar Philip A
Current Estimated Value
Purchase Details
Closed on
Jan 9, 2014
Sold by
Agc Properties Llc
Bought by
Agc Properties Inc
Purchase Details
Closed on
Dec 16, 2009
Sold by
Curtis George S and Curtis Amy L
Bought by
Agc Properties Llc
Purchase Details
Closed on
Sep 15, 2008
Sold by
Trott & Trott Pc
Bought by
Curtis George
Purchase Details
Closed on
Oct 3, 2007
Sold by
Citimortgage Inc
Bought by
Federal National Mortgage Association
Purchase Details
Closed on
Sep 25, 2007
Sold by
Simpson Roseann
Bought by
Citimortgage Inc
Purchase Details
Closed on
Oct 10, 2001
Sold by
Waterfield Mortgage Co I
Bought by
Secretary Of Housing Urban De
Purchase Details
Closed on
Feb 6, 2001
Sold by
Walker Sharon J
Bought by
Waterfield Mortgage Co Inc
Create a Home Valuation Report for This Property
The Home Valuation Report is an in-depth analysis detailing your home's value as well as a comparison with similar homes in the area
Home Values in the Area
Average Home Value in this Area
Purchase History
| Date | Buyer | Sale Price | Title Company |
|---|---|---|---|
| Linegar Philip A | $61,000 | Seaver Title Agency Llc | |
| Agc Properties Inc | -- | None Available | |
| Agc Properties Llc | -- | None Available | |
| Curtis George | $24,250 | Warranty Title Agency Llc | |
| Federal National Mortgage Association | -- | None Available | |
| Citimortgage Inc | $70,555 | None Available | |
| Secretary Of Housing Urban De | -- | -- | |
| Waterfield Mortgage Co Inc | $45,253 | -- |
Source: Public Records
Tax History
| Year | Tax Paid | Tax Assessment Tax Assessment Total Assessment is a certain percentage of the fair market value that is determined by local assessors to be the total taxable value of land and additions on the property. | Land | Improvement |
|---|---|---|---|---|
| 2025 | $1,206 | $59,110 | $0 | $0 |
| 2024 | $1,206 | $55,230 | $0 | $0 |
| 2023 | $1,152 | $49,810 | $0 | $0 |
| 2022 | $1,208 | $44,700 | $0 | $0 |
| 2021 | $937 | $0 | $0 | $0 |
| 2020 | $937 | $0 | $0 | $0 |
| 2019 | $937 | $31,480 | $0 | $0 |
| 2018 | $1,196 | $23,160 | $0 | $0 |
| 2017 | $1,160 | $23,160 | $0 | $0 |
| 2016 | $937 | $21,440 | $0 | $0 |
| 2015 | -- | $18,660 | $0 | $0 |
| 2014 | -- | $16,420 | $0 | $0 |
| 2011 | -- | $22,100 | $0 | $0 |
Source: Public Records
Map
Nearby Homes
- 896 E Dallas Ave
- 592 E Dallas Ave
- 545 E Dallas Ave
- 975 E Barrett Ave
- 973 E Guthrie Ave
- 5820 Heights Dr Unit 17 / Building 9
- 1212 E Rowland Ave
- 1176 E Kalama Ave
- 644 E Brickley Ave
- 1143 E Harwood Ave
- 31 W Barrett Ave
- 26144 Tawas St
- 45 W Hudson Ave
- 30 W Kalama Ave
- 103 W Dallas Ave
- 25747 Miracle Dr
- 627 E Mapledale Ave
- 304 W Kalama Ave
- 376 W Rowland Ave
- 374 W Barrett Ave
- 840 E Barrett Ave
- 864 E Barrett Ave
- 824 E Barrett Ave
- 849 E Rowland Ave
- 841 E Rowland Ave
- 833 E Rowland Ave
- 816 E Barrett Ave
- 857 E Rowland Ave
- 865 E Rowland Ave
- 872 E Barrett Ave
- 849 E Barrett Ave
- 825 E Rowland Ave
- 857 E Barrett Ave
- 841 E Barrett Ave
- 873 E Rowland Ave
- 880 E Barrett Ave
- 833 E Barrett Ave
- 865 E Barrett Ave
- 881 E Rowland Ave
- 825 E Barrett Ave
Your Personal Tour Guide
Ask me questions while you tour the home.