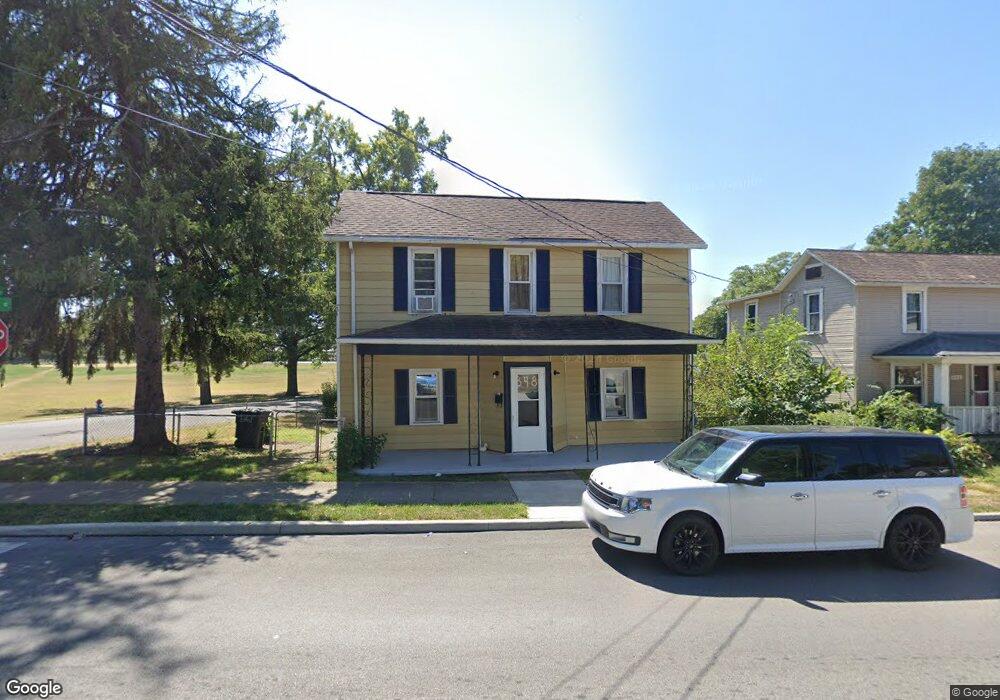
848 E Chestnut St Lancaster, OH 43130
Estimated Value: $141,000 - $248,000
2
Beds
2
Baths
1,496
Sq Ft
$131/Sq Ft
Est. Value
About This Home
This home is located at 848 E Chestnut St, Lancaster, OH 43130 and is currently estimated at $196,089, approximately $131 per square foot. 848 E Chestnut St is a home located in Fairfield County with nearby schools including Thomas Ewing Junior High School, Lancaster High School, and St Mary Elementary School.
Ownership History
Date
Name
Owned For
Owner Type
Purchase Details
Closed on
Mar 6, 2023
Sold by
Humblebee Properties Llc
Bought by
2 Honey Blossom Holdings Llc
Current Estimated Value
Home Financials for this Owner
Home Financials are based on the most recent Mortgage that was taken out on this home.
Original Mortgage
$109,500
Outstanding Balance
$101,410
Interest Rate
6.13%
Mortgage Type
Credit Line Revolving
Estimated Equity
$94,679
Create a Home Valuation Report for This Property
The Home Valuation Report is an in-depth analysis detailing your home's value as well as a comparison with similar homes in the area
Home Values in the Area
Average Home Value in this Area
Purchase History
| Date | Buyer | Sale Price | Title Company |
|---|---|---|---|
| 2 Honey Blossom Holdings Llc | -- | -- |
Source: Public Records
Mortgage History
| Date | Status | Borrower | Loan Amount |
|---|---|---|---|
| Open | 2 Honey Blossom Holdings Llc | $109,500 |
Source: Public Records
Tax History Compared to Growth
Tax History
| Year | Tax Paid | Tax Assessment Tax Assessment Total Assessment is a certain percentage of the fair market value that is determined by local assessors to be the total taxable value of land and additions on the property. | Land | Improvement |
|---|---|---|---|---|
| 2024 | $3,501 | $38,940 | $5,710 | $33,230 |
| 2023 | $1,416 | $38,940 | $5,710 | $33,230 |
| 2022 | $1,102 | $38,940 | $5,710 | $33,230 |
| 2021 | $909 | $32,080 | $5,710 | $26,370 |
| 2020 | $914 | $32,080 | $5,710 | $26,370 |
| 2019 | $828 | $32,080 | $5,710 | $26,370 |
| 2018 | $601 | $24,820 | $5,710 | $19,110 |
| 2017 | $601 | $24,820 | $5,710 | $19,110 |
| 2016 | $585 | $24,820 | $5,710 | $19,110 |
Source: Public Records
Map
Nearby Homes
- 846 E Main St
- 844 E Wheeling St
- 1106 E Walnut St
- 619 E Main St
- 403 S Ewing St
- 621 E Mulberry St
- 545 E Main St
- 534 E Wheeling St
- 641 King St
- 1408 E Wheeling St
- 1442 E Chestnut St
- 627 Harding Ave
- 632 N Eastwood Ave
- 701 Franklin Ave
- 627 Sheridan Dr
- 538 E 6th Ave
- 721 Oakwood Ave
- 517 N Maple St
- 249 N Pearl Ave
- 1560 E Main St
- 846 E Chestnut St
- 201 S Cherry St
- 832 E Chestnut St
- 129 S Cherry St
- 826 E Chestnut St
- 221 S Cherry St
- 127 S Cherry St
- 125 S Cherry St
- 820 E Chestnut St
- 140 S Cherry St
- 831 E Chestnut St
- 227 N Cherry St
- 227 N Cherry St
- 814 E Chestnut St
- 819 E Chestnut St
- 121 S Cherry St
- 130 S Cherry St
- 823 Cherokee Dr
- 812 E Chestnut St
- 124 S Cherry St