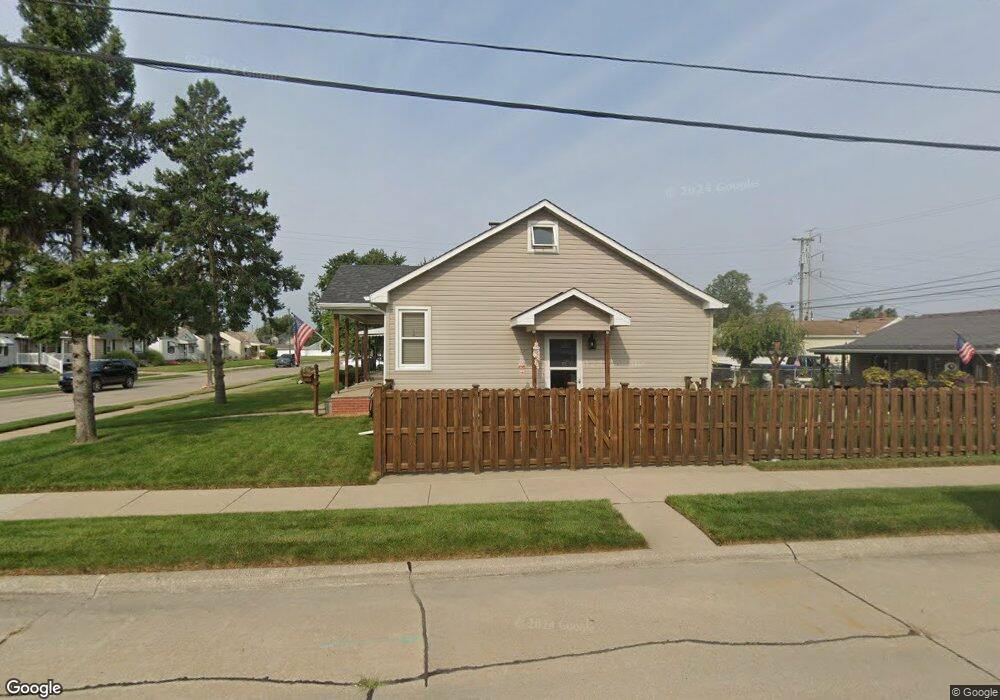
848 Hudson St Wyandotte, MI 48192
Estimated Value: $143,349 - $172,000
--
Bed
--
Bath
684
Sq Ft
$221/Sq Ft
Est. Value
About This Home
This home is located at 848 Hudson St, Wyandotte, MI 48192 and is currently estimated at $151,087, approximately $220 per square foot. 848 Hudson St is a home located in Wayne County with nearby schools including Jefferson Elementary School, Woodrow Wilson School, and Roosevelt High School.
Ownership History
Date
Name
Owned For
Owner Type
Purchase Details
Closed on
Nov 4, 2024
Sold by
Nowicki Douglas A
Bought by
Nowicki Douglas A and Nowicki Pamela
Current Estimated Value
Home Financials for this Owner
Home Financials are based on the most recent Mortgage that was taken out on this home.
Original Mortgage
$137,600
Outstanding Balance
$136,220
Interest Rate
6.08%
Mortgage Type
New Conventional
Estimated Equity
$14,867
Purchase Details
Closed on
Jan 6, 2003
Sold by
Cornwall Lois J and Cornwall Charles O
Bought by
Nowicki Douglas A
Create a Home Valuation Report for This Property
The Home Valuation Report is an in-depth analysis detailing your home's value as well as a comparison with similar homes in the area
Home Values in the Area
Average Home Value in this Area
Purchase History
| Date | Buyer | Sale Price | Title Company |
|---|---|---|---|
| Nowicki Douglas A | -- | None Listed On Document | |
| Nowicki Douglas A | -- | None Listed On Document | |
| Nowicki Douglas A | $107,000 | Community Title Services Inc |
Source: Public Records
Mortgage History
| Date | Status | Borrower | Loan Amount |
|---|---|---|---|
| Open | Nowicki Douglas A | $137,600 | |
| Closed | Nowicki Douglas A | $137,600 |
Source: Public Records
Tax History Compared to Growth
Tax History
| Year | Tax Paid | Tax Assessment Tax Assessment Total Assessment is a certain percentage of the fair market value that is determined by local assessors to be the total taxable value of land and additions on the property. | Land | Improvement |
|---|---|---|---|---|
| 2025 | $1,480 | $62,800 | $0 | $0 |
| 2024 | $1,480 | $56,900 | $0 | $0 |
| 2023 | $1,411 | $52,200 | $0 | $0 |
| 2022 | $1,634 | $47,000 | $0 | $0 |
| 2021 | $1,602 | $42,500 | $0 | $0 |
| 2020 | $1,580 | $37,800 | $0 | $0 |
| 2019 | $1,558 | $35,400 | $0 | $0 |
| 2018 | $1,243 | $33,800 | $0 | $0 |
| 2017 | $545 | $33,800 | $0 | $0 |
| 2016 | $1,504 | $30,700 | $0 | $0 |
| 2015 | $2,684 | $28,500 | $0 | $0 |
| 2013 | $2,600 | $26,000 | $0 | $0 |
| 2012 | $1,219 | $27,000 | $5,900 | $21,100 |
Source: Public Records
Map
Nearby Homes