Estimated Value: $542,000 - $1,014,000
4
Beds
2
Baths
3,169
Sq Ft
$217/Sq Ft
Est. Value
About This Home
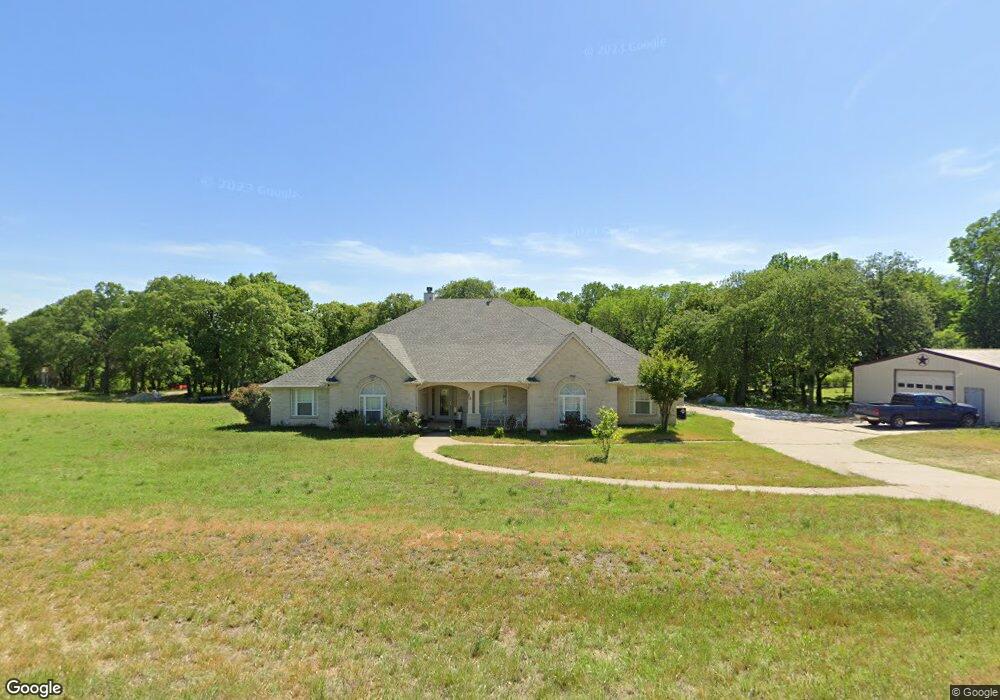
This home is located at 848 Imogene Ct, Azle, TX 76020 and is currently estimated at $689,155, approximately $217 per square foot. 848 Imogene Ct is a home located in Tarrant County with nearby schools including Liberty Elementary School, W E Hoover Elementary School, and Santo Forte Junior High School.
Ownership History
Date
Name
Owned For
Owner Type
Purchase Details
Closed on
May 17, 2021
Sold by
Newman Philip and Newman Linda J
Bought by
Newman Leonard and Newman Wanda
Current Estimated Value
Home Financials for this Owner
Home Financials are based on the most recent Mortgage that was taken out on this home.
Original Mortgage
$336,000
Outstanding Balance
$304,500
Interest Rate
3.1%
Mortgage Type
New Conventional
Estimated Equity
$384,655
Purchase Details
Closed on
Apr 15, 2002
Sold by
Newman Phillip
Bought by
Newman Phillip and Newman Linda J
Home Financials for this Owner
Home Financials are based on the most recent Mortgage that was taken out on this home.
Original Mortgage
$209,000
Interest Rate
5.87%
Mortgage Type
Purchase Money Mortgage
Purchase Details
Closed on
May 6, 1999
Sold by
The Darnell J & Susan A Penell Revocable
Bought by
Newman Phillip
Purchase Details
Closed on
Mar 24, 1997
Sold by
Gilley Gertrude and English Imogene
Bought by
Pinell Darnell and Pinell Susan
Purchase Details
Closed on
Mar 10, 1997
Sold by
Pinell Darnell J and Pinell Susan A
Bought by
Darnell J and Pinell Revocable Liv Susan A
Create a Home Valuation Report for This Property
The Home Valuation Report is an in-depth analysis detailing your home's value as well as a comparison with similar homes in the area
Home Values in the Area
Average Home Value in this Area
Purchase History
| Date | Buyer | Sale Price | Title Company |
|---|---|---|---|
| Newman Leonard | -- | Chicago Title | |
| Newman Phillip | -- | First American Title | |
| Newman Phillip | -- | Commerce Land Title | |
| Pinell Darnell | -- | First American Title Co | |
| Darnell J | -- | -- |
Source: Public Records
Mortgage History
| Date | Status | Borrower | Loan Amount |
|---|---|---|---|
| Open | Newman Leonard | $336,000 | |
| Previous Owner | Newman Phillip | $209,000 |
Source: Public Records
Tax History Compared to Growth
Tax History
| Year | Tax Paid | Tax Assessment Tax Assessment Total Assessment is a certain percentage of the fair market value that is determined by local assessors to be the total taxable value of land and additions on the property. | Land | Improvement |
|---|---|---|---|---|
| 2025 | $1,586 | $500,284 | $102,885 | $397,399 |
| 2024 | $1,586 | $500,284 | $102,885 | $397,399 |
| 2023 | $7,809 | $502,226 | $102,885 | $399,341 |
| 2022 | $8,276 | $436,524 | $62,885 | $373,639 |
| 2021 | $6,851 | $351,923 | $62,885 | $289,038 |
| 2020 | $6,764 | $347,469 | $68,975 | $278,494 |
| 2019 | $6,539 | $349,458 | $68,975 | $280,483 |
| 2018 | $5,613 | $293,519 | $68,975 | $224,544 |
| 2017 | $5,842 | $384,628 | $68,975 | $315,653 |
| 2016 | $5,311 | $296,881 | $69,075 | $227,806 |
| 2015 | $4,686 | $250,300 | $22,500 | $227,800 |
| 2014 | $4,686 | $250,300 | $22,500 | $227,800 |
Source: Public Records
Map
Nearby Homes
- 7765 Reed Rd
- 13250 Miller Rd
- 13230 Miller Rd
- 12420 Lake Forest Dr
- 7232 Courtney Dr
- 12424 Lake Forest Dr
- 7317 Briar Rd
- 13350 Miller Rd
- 13360 Miller Rd
- TBD #16 out of 13345 Briar Rd
- 6955 Allyn Dr
- 12215 Lake Forest Dr
- 12210 Lake Forest Dr
- 13690 Liberty School Rd
- 508 Amory St
- 7329 Hickey Rd
- 7425 Hickey Rd
- 13730 Williams Rd
- 9053 Lakeside Dr
- TBD Portwood Rd
- 857 Imogene Ct
- 849 Imogene Ct
- 849 Imogene Ct Unit A
- 841 Imogene Ct
- 832 Imogene Ct
- 865 Imogene Ct
- 3328 English Creek Ct
- 3316 English Creek Ct
- 3317 English Creek Ct
- 12909 Liberty School Rd
- 12935 Liberty School Rd
- 12809 Liberty School Rd
- 872 Imogene Ct
- 12921 Liberty School Rd
- 3308 English Creek Ct
- 825 Imogene Ct
- 816 Imogene Ct
- 825 English Creek Dr
- 824 English Creek Dr
- 808 Imogene Ct