
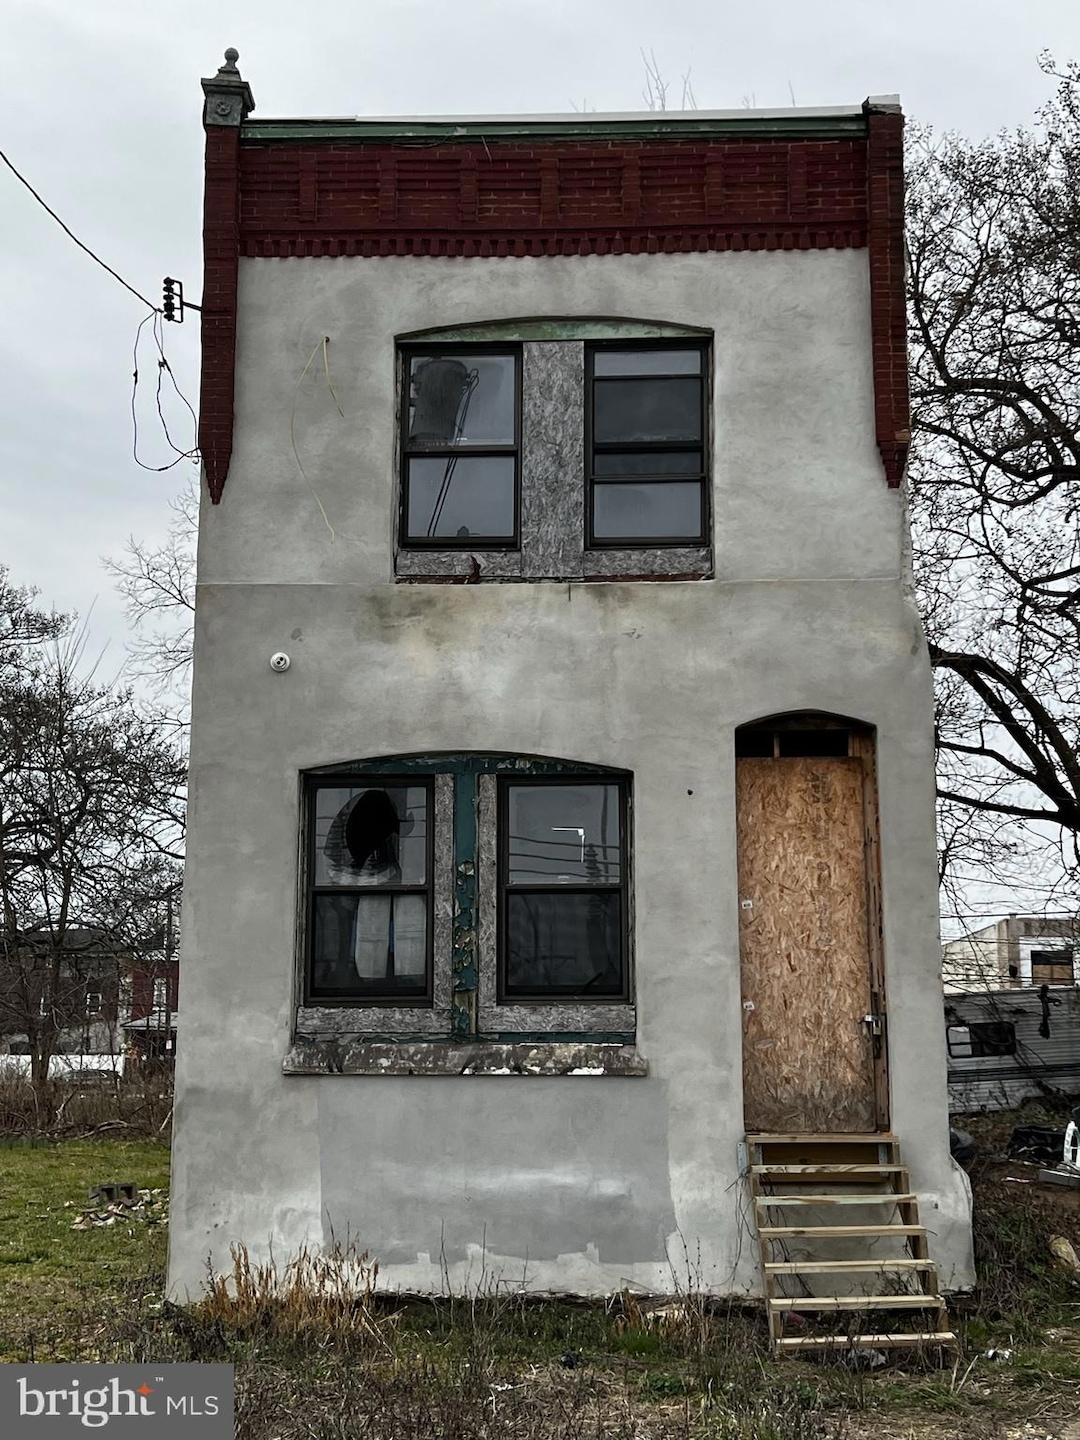


848 N Union St Philadelphia, PA 19104
Mantua Neighborhood
3
Beds
2
Baths
1,208
Sq Ft
1,065
Sq Ft Lot
Highlights
- Straight Thru Architecture
- No HOA
- Forced Air Heating and Cooling System
About This Home
As of April 2023What a great opportunity for an investor to complete this rehab! Lots of new renovations and construction nearby. Already mostly completed framing, HVAC and ductwork, hot water heater, and electrical. Schedule your showings today.
Townhouse Details
Home Type
- Townhome
Est. Annual Taxes
- $767
Year Built
- Built in 1925
Lot Details
- 1,065 Sq Ft Lot
- Lot Dimensions are 15.00 x 71.00
Home Design
- Straight Thru Architecture
- Brick Foundation
- Masonry
Interior Spaces
- 1,208 Sq Ft Home
- Property has 2 Levels
- Unfinished Basement
Bedrooms and Bathrooms
- 3 Main Level Bedrooms
- 2 Full Bathrooms
Utilities
- Forced Air Heating and Cooling System
- Natural Gas Water Heater
Community Details
- No Home Owners Association
- Belmont Subdivision
Listing and Financial Details
- Tax Lot 116
- Assessor Parcel Number 243155200
Ownership History
Date
Name
Owned For
Owner Type
Purchase Details
Closed on
Feb 23, 2021
Sold by
Rr Nadilan Llc
Bought by
King Shlomo Llc
Purchase Details
Closed on
Mar 9, 2020
Sold by
King Shiomo Llc
Bought by
Shefa Investments Of Nj Llc
Home Financials for this Owner
Home Financials are based on the most recent Mortgage that was taken out on this home.
Original Mortgage
$148,650
Interest Rate
3.1%
Mortgage Type
Commercial
Purchase Details
Listed on
Apr 2, 2019
Closed on
Jul 17, 2019
Sold by
Wilson Group Llc
Bought by
Rr Nadllan Llc
Seller's Agent
Brian K. Wilson
BHHS Fox & Roach-Center City Walnut
Buyer's Agent
Brian K. Wilson
BHHS Fox & Roach-Center City Walnut
List Price
$49,900
Sold Price
$35,000
Premium/Discount to List
-$14,900
-29.86%
Home Financials for this Owner
Home Financials are based on the most recent Mortgage that was taken out on this home.
Avg. Annual Appreciation
15.11%
Original Mortgage
$105,877
Interest Rate
3.82%
Mortgage Type
Commercial
Purchase Details
Listed on
Apr 19, 2017
Closed on
Jul 19, 2017
Sold by
Floyd Raymond Keith
Bought by
The Wilson Group Llc
Seller's Agent
Yasmeen Lockett
Marvin Capps Realty Inc
Buyer's Agent
Brian K. Wilson
BHHS Fox & Roach-Center City Walnut
List Price
$14,999
Sold Price
$13,999
Premium/Discount to List
-$1,000
-6.67%
Home Financials for this Owner
Home Financials are based on the most recent Mortgage that was taken out on this home.
Avg. Annual Appreciation
59.23%
Purchase Details
Closed on
Sep 10, 2014
Sold by
Tynes Alexander and Tynes Marie
Bought by
Floyd Raymond Keith
Purchase Details
Closed on
Sep 25, 1959
Bought by
Alexander Tynes and Alexander Marie
Similar Homes in Philadelphia, PA
Create a Home Valuation Report for This Property
The Home Valuation Report is an in-depth analysis detailing your home's value as well as a comparison with similar homes in the area
Home Values in the Area
Average Home Value in this Area
Purchase History
| Date | Type | Sale Price | Title Company |
|---|---|---|---|
| Deed | $55,000 | J&A Abstract Inc | |
| Deed | $85,000 | J&A Abstract Inc | |
| Deed | $35,000 | Platinum Abstract Co Llc | |
| Deed | $13,999 | Edge Abstract Independence L | |
| Sheriffs Deed | $5,600 | None Available | |
| Deed | -- | -- |
Source: Public Records
Mortgage History
| Date | Status | Loan Amount | Loan Type |
|---|---|---|---|
| Previous Owner | $148,650 | Commercial | |
| Previous Owner | $105,877 | Commercial |
Source: Public Records
Property History
| Date | Event | Price | Change | Sq Ft Price |
|---|---|---|---|---|
| 03/18/2025 03/18/25 | Pending | -- | -- | -- |
| 03/11/2025 03/11/25 | Price Changed | $79,900 | -5.9% | $66 / Sq Ft |
| 03/05/2025 03/05/25 | Price Changed | $84,900 | -5.6% | $70 / Sq Ft |
| 02/13/2025 02/13/25 | Price Changed | $89,900 | -10.0% | $74 / Sq Ft |
| 12/20/2024 12/20/24 | For Sale | $99,900 | +3.0% | $83 / Sq Ft |
| 04/27/2023 04/27/23 | Sold | $97,000 | -3.0% | $80 / Sq Ft |
| 03/10/2023 03/10/23 | Pending | -- | -- | -- |
| 03/02/2023 03/02/23 | For Sale | $100,000 | +185.7% | $83 / Sq Ft |
| 07/09/2019 07/09/19 | Sold | $35,000 | -18.6% | $29 / Sq Ft |
| 06/10/2019 06/10/19 | Pending | -- | -- | -- |
| 05/01/2019 05/01/19 | Price Changed | $43,000 | -4.4% | $36 / Sq Ft |
| 04/10/2019 04/10/19 | Price Changed | $45,000 | -9.8% | $37 / Sq Ft |
| 04/02/2019 04/02/19 | For Sale | $49,900 | +256.5% | $41 / Sq Ft |
| 07/20/2017 07/20/17 | Sold | $13,999 | -6.7% | $12 / Sq Ft |
| 06/27/2017 06/27/17 | Pending | -- | -- | -- |
| 06/27/2017 06/27/17 | For Sale | $14,999 | 0.0% | $12 / Sq Ft |
| 06/07/2017 06/07/17 | Price Changed | $14,999 | -18.9% | $12 / Sq Ft |
| 06/02/2017 06/02/17 | Price Changed | $18,500 | -7.5% | $15 / Sq Ft |
| 05/15/2017 05/15/17 | Price Changed | $20,000 | -20.0% | $17 / Sq Ft |
| 05/03/2017 05/03/17 | Price Changed | $25,000 | -5.7% | $21 / Sq Ft |
| 04/19/2017 04/19/17 | For Sale | $26,500 | -- | $22 / Sq Ft |
Source: Bright MLS
Tax History Compared to Growth
Tax History
| Year | Tax Paid | Tax Assessment Tax Assessment Total Assessment is a certain percentage of the fair market value that is determined by local assessors to be the total taxable value of land and additions on the property. | Land | Improvement |
|---|---|---|---|---|
| 2025 | $767 | $84,300 | $16,860 | $67,440 |
| 2024 | $767 | $84,300 | $16,860 | $67,440 |
| 2023 | $767 | $54,800 | $10,960 | $43,840 |
| 2022 | $904 | $54,800 | $10,960 | $43,840 |
| 2021 | $952 | $0 | $0 | $0 |
| 2020 | $952 | $68,000 | $10,200 | $57,800 |
| 2019 | $917 | $0 | $0 | $0 |
| 2018 | $330 | $0 | $0 | $0 |
| 2017 | $815 | $0 | $0 | $0 |
| 2016 | $815 | $0 | $0 | $0 |
| 2015 | $780 | $0 | $0 | $0 |
| 2014 | -- | $58,200 | $5,112 | $53,088 |
| 2012 | -- | $4,352 | $905 | $3,447 |
Source: Public Records
Agents Affiliated with this Home
-
Seller's Agent in 2024
Michael Cohen
KW Empower
(610) 331-7213
3 in this area
876 Total Sales
-
Seller Co-Listing Agent in 2024
Emily Mishoe
KW Empower
(267) 632-4494
1 in this area
241 Total Sales
-
Seller's Agent in 2023
Zachary Cohen
KW Empower
(610) 513-4072
2 in this area
99 Total Sales
-
Buyer's Agent in 2023
Raven Precia
KW Jersey/Keller Williams Jersey
(267) 975-1661
1 in this area
3 Total Sales
-
Seller's Agent in 2019
Brian K. Wilson
BHHS Fox & Roach
(215) 279-0576
107 Total Sales
-
Seller's Agent in 2017
Yasmeen Lockett
Marvin Capps Realty Inc
(267) 307-0207
109 Total Sales
Map
Source: Bright MLS
MLS Number: PAPH2209118
APN: 243155200
Disclaimer: Certain information contained herein is derived from information provided by parties other than Homes.com. All information provided is deemed reliable, but is not guaranteed to be accurate and should be independently verified.
![]() The data relating to real estate for sale on this website appears in part through the BRIGHT Internet Data Exchange program, a voluntary cooperative exchange of property listing data between licensed real estate brokerage firms, and is provided by BRIGHT through a licensing agreement.
The data relating to real estate for sale on this website appears in part through the BRIGHT Internet Data Exchange program, a voluntary cooperative exchange of property listing data between licensed real estate brokerage firms, and is provided by BRIGHT through a licensing agreement.
Listing information is from various brokers who participate in the Bright MLS IDX program and not all listings may be visible on the site.
The property information being provided on or through the website is for the personal, non-commercial use of consumers and such information may not be used for any purpose other than to identify prospective properties consumers may be interested in purchasing.
Some properties which appear for sale on the website may no longer be available because they are for instance, under contract, sold or are no longer being offered for sale.
Property information displayed is deemed reliable but is not guaranteed.
Copyright 2025 Bright MLS, Inc.
Nearby Homes