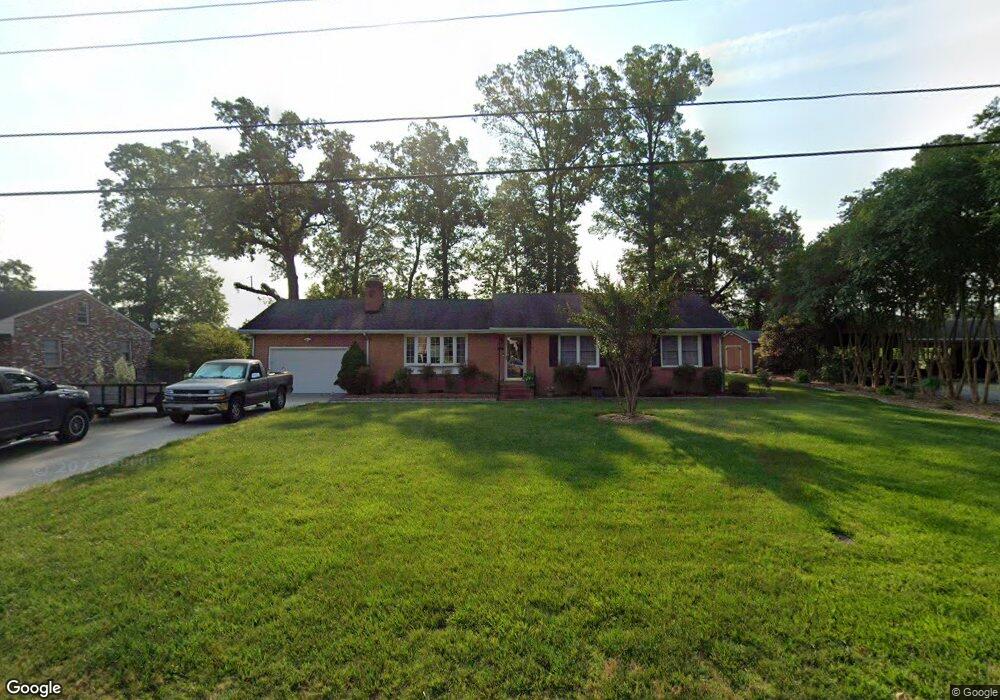
848 Normandy Dr Unit DR Suffolk, VA 23434
Cyprus NeighborhoodEstimated Value: $450,000 - $522,000
3
Beds
2
Baths
2,009
Sq Ft
$246/Sq Ft
Est. Value
About This Home
This home is located at 848 Normandy Dr Unit DR, Suffolk, VA 23434 and is currently estimated at $493,600, approximately $245 per square foot. 848 Normandy Dr Unit DR is a home located in Suffolk City with nearby schools including Nansemond Parkway Elementary School, John F. Kennedy Middle School, and King's Fork High School.
Ownership History
Date
Name
Owned For
Owner Type
Purchase Details
Closed on
Oct 13, 2022
Sold by
Sink Gary L
Bought by
Thiebaud Charles J
Current Estimated Value
Home Financials for this Owner
Home Financials are based on the most recent Mortgage that was taken out on this home.
Original Mortgage
$330,000
Outstanding Balance
$310,772
Interest Rate
4%
Mortgage Type
VA
Estimated Equity
$182,828
Purchase Details
Closed on
Feb 18, 2022
Sold by
Lynn Writtenberry Sr Albert and Lynn Susan S
Bought by
Sink Gary L
Home Financials for this Owner
Home Financials are based on the most recent Mortgage that was taken out on this home.
Original Mortgage
$435,120
Interest Rate
3.55%
Mortgage Type
VA
Purchase Details
Closed on
Oct 9, 2015
Sold by
Writtenberry A and K/A Albert Lynn Writ A Lynn
Bought by
Writtenberry Albert Lynn and Writtenberry Susan S
Create a Home Valuation Report for This Property
The Home Valuation Report is an in-depth analysis detailing your home's value as well as a comparison with similar homes in the area
Home Values in the Area
Average Home Value in this Area
Purchase History
| Date | Buyer | Sale Price | Title Company |
|---|---|---|---|
| Thiebaud Charles J | $455,000 | -- | |
| Sink Gary L | $420,000 | Landmark Title | |
| Writtenberry Albert Lynn | -- | None Available |
Source: Public Records
Mortgage History
| Date | Status | Borrower | Loan Amount |
|---|---|---|---|
| Open | Thiebaud Charles J | $330,000 | |
| Previous Owner | Sink Gary L | $435,120 |
Source: Public Records
Tax History
| Year | Tax Paid | Tax Assessment Tax Assessment Total Assessment is a certain percentage of the fair market value that is determined by local assessors to be the total taxable value of land and additions on the property. | Land | Improvement |
|---|---|---|---|---|
| 2025 | $5,937 | $512,800 | $101,500 | $411,300 |
| 2024 | $5,937 | $480,100 | $101,500 | $378,600 |
| 2023 | $5,530 | $424,700 | $101,500 | $323,200 |
| 2022 | $3,275 | $300,500 | $101,500 | $199,000 |
| 2021 | $3,270 | $294,600 | $101,500 | $193,100 |
| 2020 | $2,885 | $259,900 | $101,500 | $158,400 |
| 2019 | $2,885 | $259,900 | $101,500 | $158,400 |
| 2018 | $2,879 | $268,000 | $101,500 | $166,500 |
| 2017 | $2,868 | $268,000 | $101,500 | $166,500 |
| 2016 | $2,586 | $241,700 | $75,200 | $166,500 |
| 2015 | $1,343 | $234,800 | $75,200 | $159,600 |
| 2014 | $1,343 | $234,800 | $75,200 | $159,600 |
Source: Public Records
Map
Nearby Homes
- 418 Williams Rd
- 223 River Point Dr
- 1328 River Rd
- 403 Elizabeth St
- 108 Brassy St
- 311 Peachwood Ct
- 307 Peachwood Ct
- 104 E Pinner St
- 165 Murphys Mill Rd
- 210 Waterwood Way
- Lot 59 Bethlehem St
- 200 Seasons Cir Unit 203
- 139 Church St
- 126 Church St
- 2126 Oregon Ave
- 318 Pinner St
- 136 Mahan St
- 134 Mahan St
- 1201 Coastline Ave
- 1231 Exchange Rd
- 848 Normandy Dr
- 844 Normandy Dr
- 856 Normandy Dr
- 840 Normandy Dr
- 857 Normandy Dr
- 860 Normandy Dr
- 841 Normandy Dr
- 838 Normandy Dr
- 861 Normandy Dr
- 864 Normandy Dr
- 809 Mayflower Dr
- 837 Normandy Dr
- 836 Normandy Dr
- 821 Mayflower Dr
- 825 Mayflower Dr
- 808 Mayflower Dr
- 832 Normandy Dr
- 833 Normandy Dr
- 812 Mayflower Dr
- 804 Mayflower Dr
Your Personal Tour Guide
Ask me questions while you tour the home.