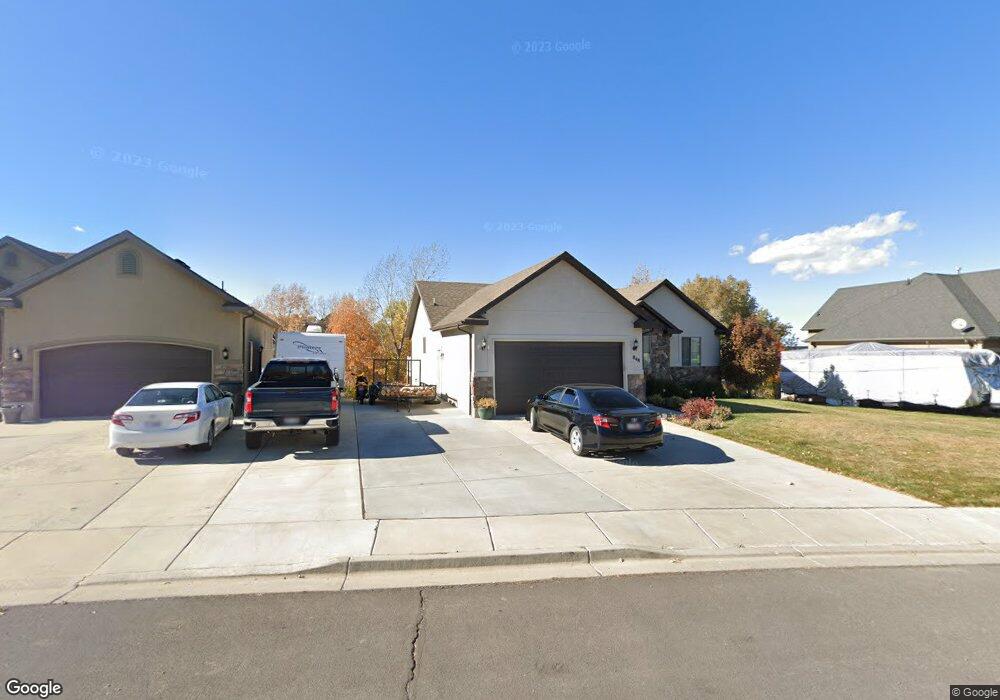
848 S 100 E Unit 57 Santaquin, UT 84655
Estimated Value: $492,000 - $524,000
3
Beds
2
Baths
1,482
Sq Ft
$344/Sq Ft
Est. Value
About This Home
This home is located at 848 S 100 E Unit 57, Santaquin, UT 84655 and is currently estimated at $510,265, approximately $344 per square foot. 848 S 100 E Unit 57 is a home located in Utah County with nearby schools including Orchard Hills Elementary School, Payson Junior High School, and Payson High School.
Ownership History
Date
Name
Owned For
Owner Type
Purchase Details
Closed on
Oct 30, 2013
Sold by
Greenhalgh Marc H
Bought by
Greenhalgh Marc H and Greenhalgh Angela M
Current Estimated Value
Home Financials for this Owner
Home Financials are based on the most recent Mortgage that was taken out on this home.
Original Mortgage
$221,326
Outstanding Balance
$166,548
Interest Rate
4.46%
Mortgage Type
New Conventional
Estimated Equity
$343,717
Purchase Details
Closed on
Sep 13, 2011
Sold by
Federal Deposit Insurance Corporation
Bought by
Office Owners Llc
Purchase Details
Closed on
Nov 25, 2009
Sold by
Field Robert B
Bought by
Barnes Banking Company
Purchase Details
Closed on
May 2, 2008
Sold by
Santaquin 66 Llc
Bought by
Field Robert B
Home Financials for this Owner
Home Financials are based on the most recent Mortgage that was taken out on this home.
Original Mortgage
$209,500
Interest Rate
5.88%
Mortgage Type
Purchase Money Mortgage
Create a Home Valuation Report for This Property
The Home Valuation Report is an in-depth analysis detailing your home's value as well as a comparison with similar homes in the area
Home Values in the Area
Average Home Value in this Area
Purchase History
| Date | Buyer | Sale Price | Title Company |
|---|---|---|---|
| Greenhalgh Marc H | -- | First American Title Co Llc | |
| Greenhalgh Marc H | -- | Pro Title & Escrow Inc | |
| Office Owners Llc | -- | Premier Title Insurance Agen | |
| Barnes Banking Company | -- | Landmark Title Company | |
| Field Robert B | -- | First American Ncs South |
Source: Public Records
Mortgage History
| Date | Status | Borrower | Loan Amount |
|---|---|---|---|
| Open | Greenhalgh Marc H | $221,326 | |
| Previous Owner | Field Robert B | $209,500 |
Source: Public Records
Tax History Compared to Growth
Tax History
| Year | Tax Paid | Tax Assessment Tax Assessment Total Assessment is a certain percentage of the fair market value that is determined by local assessors to be the total taxable value of land and additions on the property. | Land | Improvement |
|---|---|---|---|---|
| 2025 | $2,499 | $259,105 | $186,800 | $284,300 |
| 2024 | $2,499 | $248,875 | $0 | $0 |
| 2023 | $2,586 | $258,390 | $0 | $0 |
| 2022 | $2,692 | $277,420 | $0 | $0 |
| 2021 | $2,179 | $348,100 | $90,300 | $257,800 |
| 2020 | $2,093 | $324,000 | $78,500 | $245,500 |
| 2019 | $1,880 | $297,600 | $78,500 | $219,100 |
| 2018 | $1,825 | $275,500 | $74,800 | $200,700 |
| 2017 | $1,742 | $140,470 | $0 | $0 |
| 2016 | $1,716 | $135,575 | $0 | $0 |
| 2015 | $1,616 | $125,235 | $0 | $0 |
| 2014 | $1,578 | $122,045 | $0 | $0 |
Source: Public Records
Map
Nearby Homes
- 163 E 850 S
- 873 S 250 E
- 822 S Horizon Loop Unit 513
- 14975 S Canyon Rd
- 781 S Brubaker Way
- 879 S Brubaker Way
- 866 S Brubaker Way
- 14717 S 5200 W
- 1077 S Red Barn View Dr
- 498 S 300 E
- 577 S 500 E
- 521 E 550 S
- 50 W 400 S
- 700 S 300 W
- 1308 S Raintree Ln
- 626 S 690 E
- 1123 Red Cliff Dr
- 295 E 300 S
- 260 S Center St
- 20 E 200 S