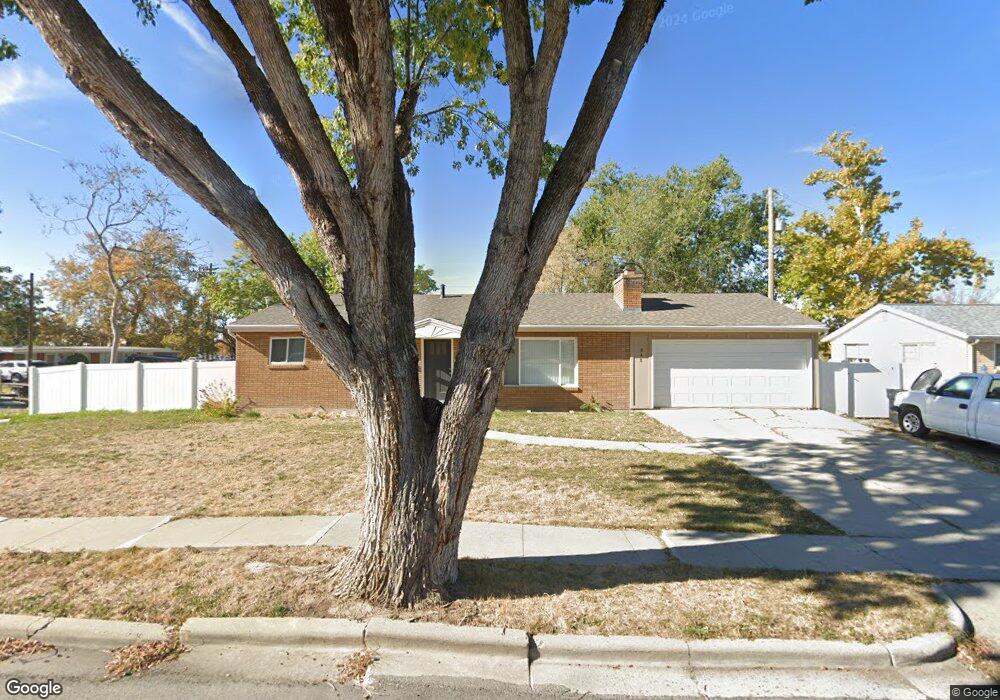
848 S 175 W Bountiful, UT 84010
Estimated Value: $493,000 - $561,000
4
Beds
3
Baths
2,336
Sq Ft
$225/Sq Ft
Est. Value
About This Home
This home is located at 848 S 175 W, Bountiful, UT 84010 and is currently estimated at $526,220, approximately $225 per square foot. 848 S 175 W is a home located in Davis County with nearby schools including Bountiful Elementary School, Millcreek Junior High School, and Bountiful High School.
Ownership History
Date
Name
Owned For
Owner Type
Purchase Details
Closed on
Mar 1, 2016
Sold by
Bennett Brandon T and Bennett Hanna M
Bought by
Bennett Brandon T and Bennett Hanna M
Current Estimated Value
Home Financials for this Owner
Home Financials are based on the most recent Mortgage that was taken out on this home.
Original Mortgage
$157,859
Outstanding Balance
$125,019
Interest Rate
3.75%
Mortgage Type
FHA
Estimated Equity
$401,201
Purchase Details
Closed on
Feb 8, 2011
Sold by
Porter Glen S and Porter Desiree L
Bought by
Bennett Brandon T and Bennett Hanna M
Home Financials for this Owner
Home Financials are based on the most recent Mortgage that was taken out on this home.
Original Mortgage
$172,772
Interest Rate
4.5%
Mortgage Type
FHA
Purchase Details
Closed on
Jun 16, 2010
Sold by
Baker Reynold L and Baker Diane M
Bought by
Bennett Brandon T and Bennett Hanna M
Home Financials for this Owner
Home Financials are based on the most recent Mortgage that was taken out on this home.
Original Mortgage
$170,195
Interest Rate
4.5%
Mortgage Type
FHA
Create a Home Valuation Report for This Property
The Home Valuation Report is an in-depth analysis detailing your home's value as well as a comparison with similar homes in the area
Purchase History
| Date | Buyer | Sale Price | Title Company |
|---|---|---|---|
| Bennett Brandon T | -- | Advanced Title | |
| Bennett Brandon T | -- | Advanced Title Ins Ag Sl | |
| Bennett Brandon T | -- | Executive Title Ins Agen |
Source: Public Records
Mortgage History
| Date | Status | Borrower | Loan Amount |
|---|---|---|---|
| Open | Bennett Brandon T | $157,859 | |
| Closed | Bennett Brandon T | $172,772 | |
| Previous Owner | Bennett Brandon T | $170,195 |
Source: Public Records
Tax History
| Year | Tax Paid | Tax Assessment Tax Assessment Total Assessment is a certain percentage of the fair market value that is determined by local assessors to be the total taxable value of land and additions on the property. | Land | Improvement |
|---|---|---|---|---|
| 2025 | $2,953 | $267,300 | $125,959 | $141,341 |
| 2024 | $2,746 | $257,950 | $112,627 | $145,323 |
| 2023 | $2,635 | $449,000 | $207,170 | $241,830 |
| 2022 | $2,627 | $245,300 | $113,115 | $132,185 |
| 2021 | $2,382 | $340,000 | $148,039 | $191,961 |
| 2020 | $2,092 | $299,000 | $126,335 | $172,665 |
| 2019 | $2,145 | $300,000 | $132,585 | $167,415 |
| 2018 | $1,994 | $274,000 | $130,333 | $143,667 |
| 2016 | $1,688 | $125,400 | $54,553 | $70,847 |
| 2015 | $1,640 | $114,895 | $54,553 | $60,342 |
| 2014 | $1,558 | $112,071 | $54,553 | $57,518 |
| 2013 | -- | $99,663 | $34,381 | $65,282 |
Source: Public Records
Map
Nearby Homes
- 109 W 900 S
- 360 W 800 S
- 650 S Main St Unit 9106
- 650 S Main St Unit 6111
- 1016 S 400 W
- 1350 S 200 W
- 1314 S 200 W Unit 19
- 34 W 400 S
- 32 W 400 S
- 545 S 100 E
- 990 S 500 W
- 553 Clark St
- 275 E Peach Ln S
- 337 Peach Ln
- 103 S 100 E
- 1654 S 100 E
- 141 E 1650 S
- 75 N Peregrine Ln W Unit 8
- 1602 S 550 W
- 520 S Orchard Dr Unit 17
Your Personal Tour Guide
Ask me questions while you tour the home.