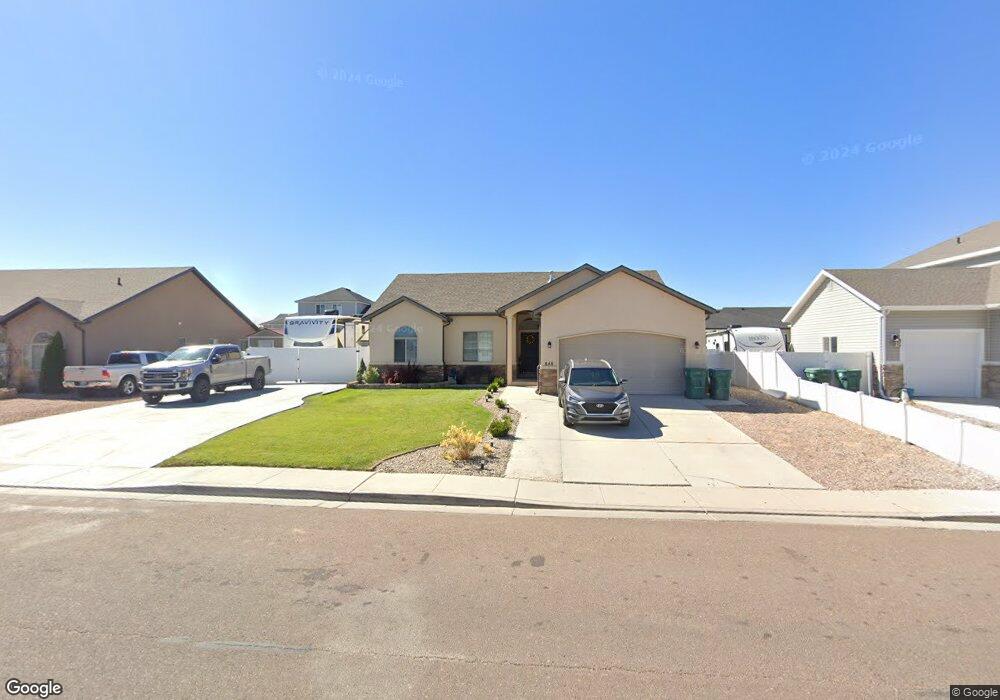
848 S 250 W Unit 121 Vernal, UT 84078
Estimated Value: $346,000 - $444,000
3
Beds
2
Baths
1,588
Sq Ft
$248/Sq Ft
Est. Value
About This Home
This home is located at 848 S 250 W Unit 121, Vernal, UT 84078 and is currently estimated at $394,614, approximately $248 per square foot. 848 S 250 W Unit 121 is a home located in Uintah County with nearby schools including Discovery School, Vernal Middle School, and Uintah Middle School.
Ownership History
Date
Name
Owned For
Owner Type
Purchase Details
Closed on
Apr 5, 2012
Sold by
Brulez Raymond A
Bought by
Stock Loan Services Llc
Current Estimated Value
Purchase Details
Closed on
Oct 3, 2011
Sold by
Brulez Raymond A
Bought by
Vernal Housing Llc
Purchase Details
Closed on
Jun 25, 2009
Sold by
Harbor Real Asset Fund
Bought by
Hraf Holdings Llc
Purchase Details
Closed on
Dec 31, 2007
Sold by
The Elva Group Llc
Bought by
Brulez Raymond A
Home Financials for this Owner
Home Financials are based on the most recent Mortgage that was taken out on this home.
Original Mortgage
$37,851
Interest Rate
6.05%
Mortgage Type
Unknown
Purchase Details
Closed on
Oct 10, 2007
Sold by
D & M Development Services Llc
Bought by
Elva Group Llc
Purchase Details
Closed on
Sep 15, 2006
Sold by
Elva Group Llc
Bought by
D & M Development Services Llc
Create a Home Valuation Report for This Property
The Home Valuation Report is an in-depth analysis detailing your home's value as well as a comparison with similar homes in the area
Home Values in the Area
Average Home Value in this Area
Purchase History
| Date | Buyer | Sale Price | Title Company |
|---|---|---|---|
| Stock Loan Services Llc | -- | Lincoln Title Ins Agency | |
| Fixture Filing And Stock Loan Services | -- | Lincoln Title Insurance Agen | |
| Vernal Housing Llc | -- | None Available | |
| Hraf Holdings Llc | -- | -- | |
| Brulez Raymond A | -- | -- | |
| Elva Group Llc | -- | -- | |
| D & M Development Services Llc | -- | -- |
Source: Public Records
Mortgage History
| Date | Status | Borrower | Loan Amount |
|---|---|---|---|
| Previous Owner | Brulez Raymond A | $37,851 | |
| Previous Owner | Brulez Raymond A | $206,400 |
Source: Public Records
Tax History Compared to Growth
Tax History
| Year | Tax Paid | Tax Assessment Tax Assessment Total Assessment is a certain percentage of the fair market value that is determined by local assessors to be the total taxable value of land and additions on the property. | Land | Improvement |
|---|---|---|---|---|
| 2024 | $1,701 | $193,139 | $17,938 | $175,201 |
| 2023 | $1,701 | $157,385 | $17,362 | $140,023 |
| 2022 | $1,398 | $129,381 | $17,362 | $112,019 |
| 2021 | $1,419 | $59,639 | $9,549 | $50,090 |
| 2020 | $1,379 | $108,434 | $17,362 | $91,072 |
| 2019 | $1,269 | $98,473 | $16,500 | $81,973 |
| 2018 | $1,221 | $94,569 | $16,500 | $78,069 |
| 2017 | $12 | $100,069 | $22,000 | $78,069 |
| 2016 | $1,136 | $96,984 | $16,500 | $80,484 |
| 2015 | $1,095 | $101,220 | $16,500 | $84,720 |
| 2014 | $1,081 | $101,220 | $16,500 | $84,720 |
| 2013 | $607 | $55,640 | $8,250 | $47,390 |
Source: Public Records
Map
Nearby Homes