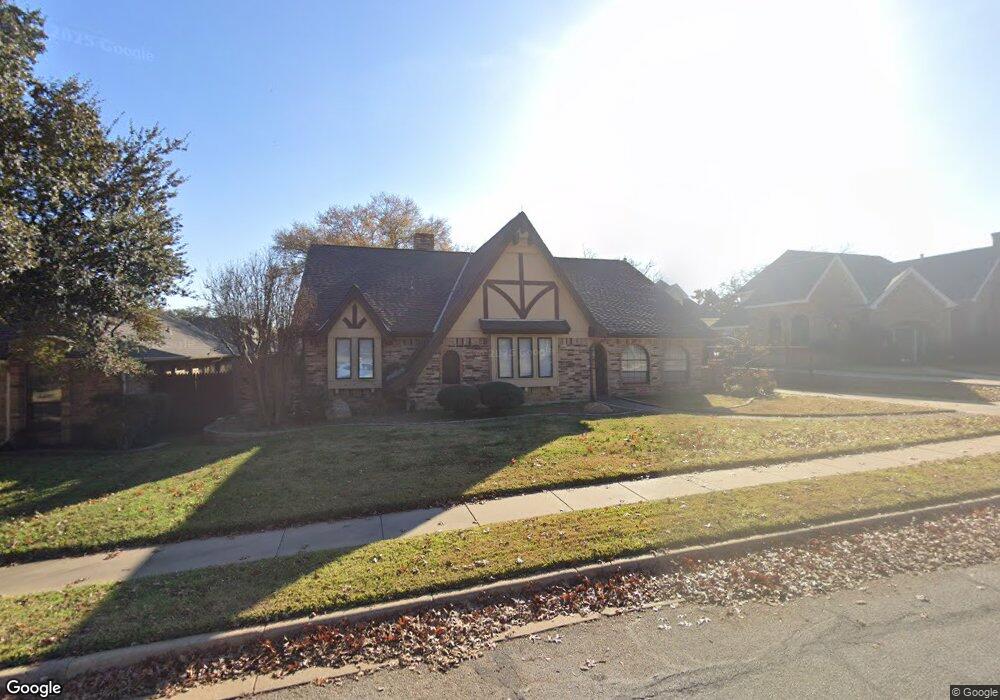
848 Shady Lake Dr Bedford, TX 76021
Estimated Value: $483,000 - $504,000
3
Beds
2
Baths
2,459
Sq Ft
$200/Sq Ft
Est. Value
About This Home
This home is located at 848 Shady Lake Dr, Bedford, TX 76021 and is currently estimated at $491,984, approximately $200 per square foot. 848 Shady Lake Dr is a home located in Tarrant County with nearby schools including Shady Brook Elementary School, Bedford Junior High School, and L.D. Bell High School.
Ownership History
Date
Name
Owned For
Owner Type
Purchase Details
Closed on
Mar 13, 2017
Sold by
St Josephs Rentals Llc
Bought by
Mendoza Lupita and Mendoza Luise E
Current Estimated Value
Home Financials for this Owner
Home Financials are based on the most recent Mortgage that was taken out on this home.
Original Mortgage
$311,600
Outstanding Balance
$258,539
Interest Rate
4.19%
Mortgage Type
New Conventional
Estimated Equity
$233,445
Purchase Details
Closed on
Nov 29, 2016
Sold by
To Thavaro and To Rachel
Bought by
St Joseph Rentals Llc
Purchase Details
Closed on
Oct 1, 2008
Sold by
Pry John W and Pry Robyn
Bought by
To Thavaro and To Rachel
Home Financials for this Owner
Home Financials are based on the most recent Mortgage that was taken out on this home.
Original Mortgage
$199,108
Interest Rate
6.46%
Mortgage Type
VA
Purchase Details
Closed on
Sep 28, 1995
Sold by
Mattarocci Thomas P and Mattarocci Rose A
Bought by
Pry John W
Home Financials for this Owner
Home Financials are based on the most recent Mortgage that was taken out on this home.
Original Mortgage
$115,000
Interest Rate
7.84%
Create a Home Valuation Report for This Property
The Home Valuation Report is an in-depth analysis detailing your home's value as well as a comparison with similar homes in the area
Home Values in the Area
Average Home Value in this Area
Purchase History
| Date | Buyer | Sale Price | Title Company |
|---|---|---|---|
| Mendoza Lupita | -- | None Available | |
| St Joseph Rentals Llc | -- | None Available | |
| To Thavaro | -- | Providence Title Company | |
| Pry John W | -- | Safeco Land Title |
Source: Public Records
Mortgage History
| Date | Status | Borrower | Loan Amount |
|---|---|---|---|
| Open | Mendoza Lupita | $311,600 | |
| Previous Owner | To Thavaro | $199,108 | |
| Previous Owner | Pry John W | $115,000 |
Source: Public Records
Tax History Compared to Growth
Tax History
| Year | Tax Paid | Tax Assessment Tax Assessment Total Assessment is a certain percentage of the fair market value that is determined by local assessors to be the total taxable value of land and additions on the property. | Land | Improvement |
|---|---|---|---|---|
| 2025 | $7,772 | $469,563 | $90,000 | $379,563 |
| 2024 | $7,772 | $469,563 | $90,000 | $379,563 |
| 2023 | $8,718 | $454,516 | $65,000 | $389,516 |
| 2022 | $9,463 | $448,744 | $65,000 | $383,744 |
| 2021 | $9,278 | $395,261 | $65,000 | $330,261 |
| 2020 | $8,513 | $358,062 | $65,000 | $293,062 |
| 2019 | $8,413 | $368,923 | $65,000 | $303,923 |
| 2018 | $7,266 | $314,811 | $65,000 | $249,811 |
| 2017 | $7,319 | $302,550 | $40,000 | $262,550 |
| 2016 | $6,309 | $271,862 | $40,000 | $231,862 |
| 2015 | $5,679 | $237,100 | $28,000 | $209,100 |
| 2014 | $5,679 | $237,100 | $28,000 | $209,100 |
Source: Public Records
Map
Nearby Homes
- 2420 Stonegate Dr N
- 2436 Brookgreen Ct
- 817 Shady Lake Dr
- 1740 Brown Trail
- 2225 Shady Brook Dr
- 2317 Shady Grove Dr
- 2501 Shady Grove Dr
- 922 Shady Creek Ln
- 2508 Lakeview Dr
- 801 Shady Creek Ln
- 2116 Tamworth Ct
- 2700 Shady Grove Dr
- 1013 Springdale Rd
- 2704 Shady Grove Dr
- 3119 Spring Grove Dr
- 432 Sunnybrook Ct
- 1732 Jeannie Ln
- 124 Jeannie Ct
- 121 Kay Ct
- 49 Morrow Dr
- 852 Shady Lake Dr
- 844 Shady Lake Dr
- 841 Birdsong
- 837 Birdsong
- 845 Birdsong
- 856 Shady Lake Dr
- 840 Shady Lake Dr
- 849 Shady Lake Dr
- 853 Shady Lake Dr
- 833 Birdsong
- 845 Shady Lake Dr
- 849 Birdsong
- 857 Shady Lake Dr
- 836 Shady Lake Dr
- 2433 Spring Valley Dr
- 841 Shady Lake Dr
- 829 Birdsong
- 2429 Spring Valley Dr
- 840 Birdsong
- 832 Mayfair Hill Ct