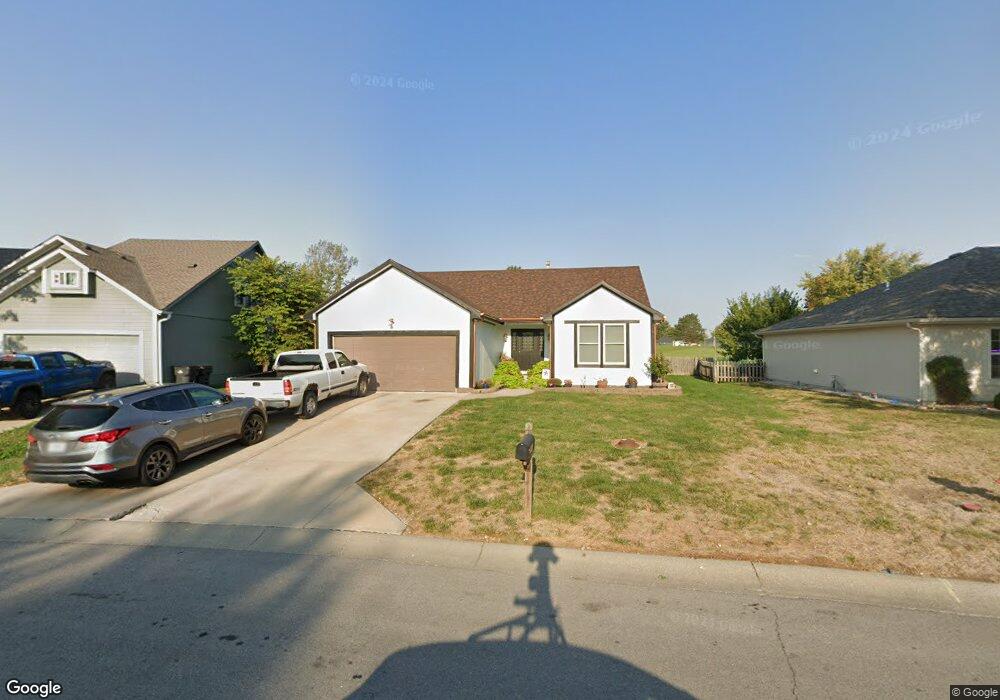
848 SW Meadowood Dr Grain Valley, MO 64029
Estimated Value: $286,066 - $307,000
3
Beds
3
Baths
1,202
Sq Ft
$248/Sq Ft
Est. Value
About This Home
This home is located at 848 SW Meadowood Dr, Grain Valley, MO 64029 and is currently estimated at $298,267, approximately $248 per square foot. 848 SW Meadowood Dr is a home located in Jackson County with nearby schools including Grain Valley High School.
Ownership History
Date
Name
Owned For
Owner Type
Purchase Details
Closed on
Jul 18, 2018
Sold by
Murray Benjamin and Murray Ashley L
Bought by
Edwards Jordan and Edwards Karly
Current Estimated Value
Home Financials for this Owner
Home Financials are based on the most recent Mortgage that was taken out on this home.
Original Mortgage
$166,920
Outstanding Balance
$144,661
Interest Rate
4.5%
Mortgage Type
FHA
Estimated Equity
$153,606
Purchase Details
Closed on
Feb 27, 2009
Sold by
Bown David B and Bown Sarah M
Bought by
Bown Ashley L
Home Financials for this Owner
Home Financials are based on the most recent Mortgage that was taken out on this home.
Original Mortgage
$127,645
Interest Rate
5.13%
Mortgage Type
FHA
Purchase Details
Closed on
Mar 26, 2001
Sold by
Fireside Builders Lc
Bought by
Bown David B and Bown Sarah M
Home Financials for this Owner
Home Financials are based on the most recent Mortgage that was taken out on this home.
Original Mortgage
$115,983
Interest Rate
6.98%
Mortgage Type
FHA
Create a Home Valuation Report for This Property
The Home Valuation Report is an in-depth analysis detailing your home's value as well as a comparison with similar homes in the area
Home Values in the Area
Average Home Value in this Area
Purchase History
| Date | Buyer | Sale Price | Title Company |
|---|---|---|---|
| Edwards Jordan | -- | Security 1St Title | |
| Bown Ashley L | -- | First American Title | |
| Bown David B | -- | Security Land Title Company |
Source: Public Records
Mortgage History
| Date | Status | Borrower | Loan Amount |
|---|---|---|---|
| Open | Edwards Jordan | $166,920 | |
| Previous Owner | Bown Ashley L | $127,645 | |
| Previous Owner | Bown David B | $115,983 |
Source: Public Records
Tax History Compared to Growth
Tax History
| Year | Tax Paid | Tax Assessment Tax Assessment Total Assessment is a certain percentage of the fair market value that is determined by local assessors to be the total taxable value of land and additions on the property. | Land | Improvement |
|---|---|---|---|---|
| 2025 | $3,492 | $43,470 | $7,735 | $35,735 |
| 2024 | $3,492 | $42,402 | $4,478 | $37,924 |
| 2023 | $3,362 | $42,402 | $6,519 | $35,883 |
| 2022 | $2,980 | $32,870 | $5,320 | $27,550 |
| 2021 | $2,910 | $32,870 | $5,320 | $27,550 |
| 2020 | $2,952 | $32,889 | $5,320 | $27,569 |
| 2019 | $2,892 | $32,889 | $5,320 | $27,569 |
| 2018 | $1,418,440 | $28,386 | $3,321 | $25,065 |
| 2017 | $2,603 | $28,386 | $3,321 | $25,065 |
| 2016 | $2,603 | $27,674 | $3,316 | $24,358 |
| 2014 | $2,571 | $27,132 | $3,251 | $23,881 |
Source: Public Records
Map
Nearby Homes
- 601 SW Nelson Dr
- 501 SW Creek Ridge Dr
- 808 SW Country Hill Dr
- 836 SW Lee Ann Dr
- 1001 SW Cross Creek Dr
- 309 SW Creek Ridge Dr
- 1010 SW Cross Creek Dr
- 621 SW Tisha Ln
- 912 SW Foxtail Dr
- 709 SW Harvest Cir
- 913 SW Abar Dr
- 506 SW Meadowood Dr
- 1400 SW Cross Creek Dr
- 800 SW Hilltop Ct
- 115 E Old Us 40 Hwy N A
- 636 SW Lakeview Dr
- 1203 SW Lakeview Dr
- 1214 SW Windcrest Ct
- 1219 SW Windcrest Ct
- 1026 SW Sandy Ln
- 848 SW Meadowood Dr
- 844 SW Meadowood Dr
- 852 SW Meadowood Dr
- 840 SW Meadowood Dr
- 854 SW Meadowood Dr
- 633 SW Gateway Dr
- 836 SW Meadowood Dr
- 856 SW Meadowood Dr
- 622 SW Muriel Dr
- 629 SW Gateway Dr
- 630 SW Gateway Dr
- 832 SW Meadowood Dr
- 620 SW Muriel Dr
- 858 SW Meadowood Dr
- 828 SW Meadowood Dr
- 626 SW Gateway Dr
- 625 SW Gateway Dr
- 626 SW Sunset Dr
- 626 SW Sunset Dr
- 618 SW Muriel Dr