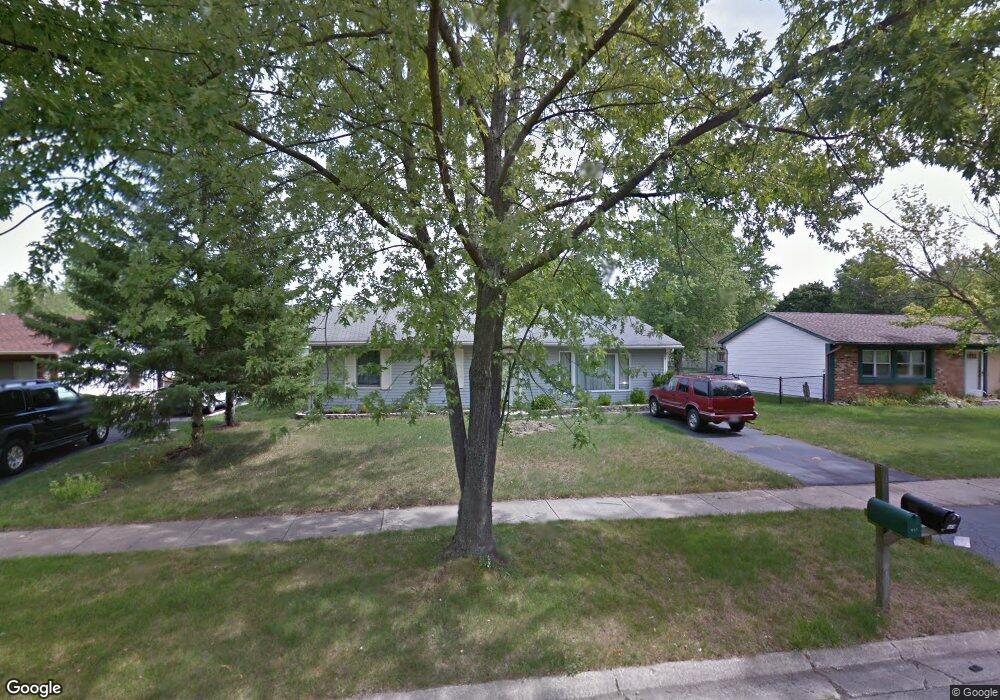
848 Tamms Ln Bolingbrook, IL 60440
Poplar Park NeighborhoodEstimated Value: $272,597 - $317,000
4
Beds
2
Baths
1,264
Sq Ft
$231/Sq Ft
Est. Value
About This Home
This home is located at 848 Tamms Ln, Bolingbrook, IL 60440 and is currently estimated at $291,899, approximately $230 per square foot. 848 Tamms Ln is a home located in Will County with nearby schools including Independence Elementary School, Jane Addams Middle School, and Bolingbrook High School.
Ownership History
Date
Name
Owned For
Owner Type
Purchase Details
Closed on
Jan 28, 2005
Sold by
Hansen Sarah C
Bought by
Hansen Matthew P
Current Estimated Value
Purchase Details
Closed on
Aug 23, 1996
Sold by
Hill Laura L
Bought by
Jackson Thomas P and Jackson Kimberly D
Home Financials for this Owner
Home Financials are based on the most recent Mortgage that was taken out on this home.
Original Mortgage
$104,805
Outstanding Balance
$8,344
Interest Rate
8.29%
Mortgage Type
VA
Estimated Equity
$283,555
Create a Home Valuation Report for This Property
The Home Valuation Report is an in-depth analysis detailing your home's value as well as a comparison with similar homes in the area
Home Values in the Area
Average Home Value in this Area
Purchase History
| Date | Buyer | Sale Price | Title Company |
|---|---|---|---|
| Hansen Matthew P | -- | -- | |
| Jackson Thomas P | $102,000 | -- |
Source: Public Records
Mortgage History
| Date | Status | Borrower | Loan Amount |
|---|---|---|---|
| Open | Jackson Thomas P | $104,805 |
Source: Public Records
Tax History
| Year | Tax Paid | Tax Assessment Tax Assessment Total Assessment is a certain percentage of the fair market value that is determined by local assessors to be the total taxable value of land and additions on the property. | Land | Improvement |
|---|---|---|---|---|
| 2024 | $6,693 | $80,465 | $17,938 | $62,527 |
| 2023 | $6,693 | $72,400 | $16,140 | $56,260 |
| 2022 | $5,732 | $63,992 | $14,266 | $49,726 |
| 2021 | $5,420 | $59,834 | $13,339 | $46,495 |
| 2020 | $5,246 | $57,866 | $12,900 | $44,966 |
| 2019 | $5,067 | $55,111 | $12,286 | $42,825 |
| 2018 | $4,695 | $51,202 | $11,415 | $39,787 |
| 2017 | $4,458 | $48,533 | $10,820 | $37,713 |
| 2016 | $4,317 | $46,200 | $10,300 | $35,900 |
| 2015 | $3,920 | $44,300 | $9,900 | $34,400 |
| 2014 | $3,920 | $40,300 | $9,000 | $31,300 |
| 2013 | $3,920 | $42,400 | $9,500 | $32,900 |
Source: Public Records
Map
Nearby Homes
- 867 Harris Dr Unit 5
- 217 S Orchard Dr
- 313 Fox Bend Cir
- 4 Franklin Ct Unit 2
- 167 Penny Ln
- 333 Claridge Cir
- 118 Springleaf Dr Unit 5
- 184 Fox Bend Cir
- 160 Galewood Dr
- 164 Galewood Dr
- 8 Lily Ct
- 265 Commonwealth Dr Unit 1
- 10 Lindsey Ct W
- 1086 Lily Field Ln
- 209 Bunker Hill Dr
- 401 Foxborough Trail
- 154 Grady Dr
- 1150 Coventry Ln
- 845 Barclay Dr
- 209 Mill Stream Dr
Your Personal Tour Guide
Ask me questions while you tour the home.