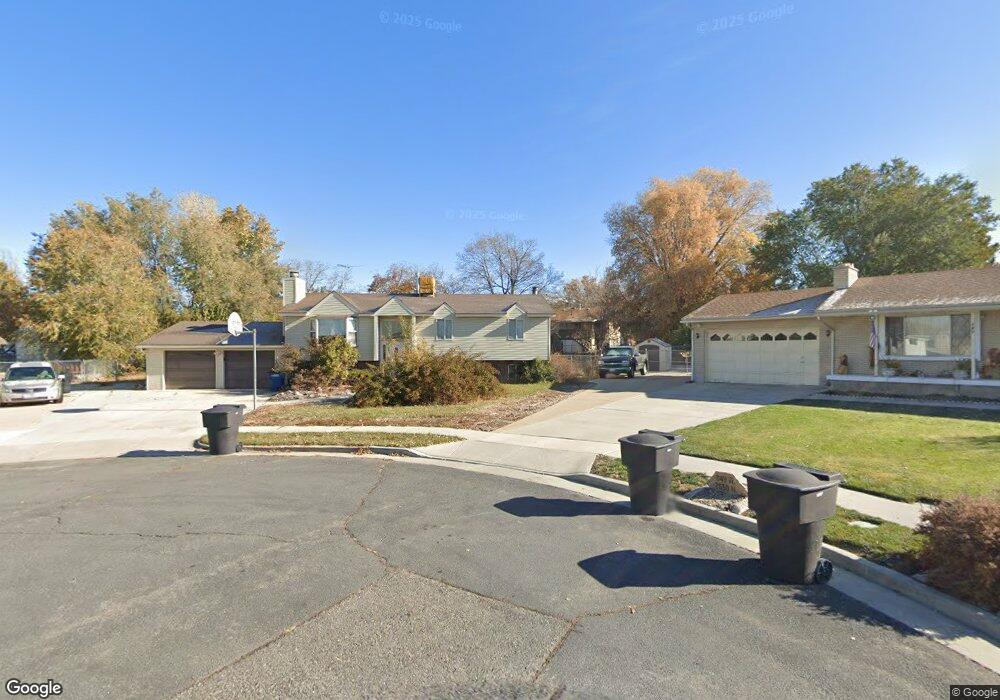
848 W 2650 N Clearfield, UT 84015
Estimated Value: $467,000 - $529,000
4
Beds
3
Baths
2,583
Sq Ft
$190/Sq Ft
Est. Value
About This Home
This home is located at 848 W 2650 N, Clearfield, UT 84015 and is currently estimated at $490,578, approximately $189 per square foot. 848 W 2650 N is a home located in Davis County with nearby schools including Fremont School, Sunset Junior High School, and Northridge High School.
Ownership History
Date
Name
Owned For
Owner Type
Purchase Details
Closed on
Sep 11, 2003
Sold by
Relocation Resources International Inc
Bought by
Colbert Tracy
Current Estimated Value
Home Financials for this Owner
Home Financials are based on the most recent Mortgage that was taken out on this home.
Original Mortgage
$145,000
Outstanding Balance
$65,892
Interest Rate
6.06%
Mortgage Type
VA
Estimated Equity
$424,686
Purchase Details
Closed on
May 15, 2003
Sold by
Stong Ricky K and Stong Song
Bought by
Relocation Resources International Inc
Purchase Details
Closed on
Mar 31, 1998
Sold by
Wheelock Ellen
Bought by
Nelson & Nelson Inc
Create a Home Valuation Report for This Property
The Home Valuation Report is an in-depth analysis detailing your home's value as well as a comparison with similar homes in the area
Home Values in the Area
Average Home Value in this Area
Purchase History
| Date | Buyer | Sale Price | Title Company |
|---|---|---|---|
| Colbert Tracy | -- | Backman Stewart Title Servic | |
| Relocation Resources International Inc | -- | Backman Stewart Title Servic | |
| Nelson & Nelson Inc | -- | First American Title Co |
Source: Public Records
Mortgage History
| Date | Status | Borrower | Loan Amount |
|---|---|---|---|
| Open | Colbert Tracy | $145,000 |
Source: Public Records
Tax History Compared to Growth
Tax History
| Year | Tax Paid | Tax Assessment Tax Assessment Total Assessment is a certain percentage of the fair market value that is determined by local assessors to be the total taxable value of land and additions on the property. | Land | Improvement |
|---|---|---|---|---|
| 2025 | $2,694 | $259,050 | $113,871 | $145,179 |
| 2024 | $2,600 | $251,350 | $123,047 | $128,303 |
| 2023 | $2,387 | $427,000 | $143,732 | $283,268 |
| 2022 | $2,535 | $250,800 | $83,412 | $167,388 |
| 2021 | $2,296 | $337,000 | $112,119 | $224,881 |
| 2020 | $1,990 | $289,000 | $99,586 | $189,414 |
| 2019 | $1,931 | $274,000 | $108,473 | $165,527 |
| 2018 | $1,722 | $240,000 | $90,631 | $149,369 |
| 2016 | $1,501 | $108,075 | $36,155 | $71,920 |
| 2015 | $1,454 | $99,495 | $36,155 | $63,340 |
| 2014 | $1,410 | $98,013 | $36,155 | $61,858 |
| 2013 | -- | $83,770 | $26,945 | $56,825 |
Source: Public Records
Map
Nearby Homes