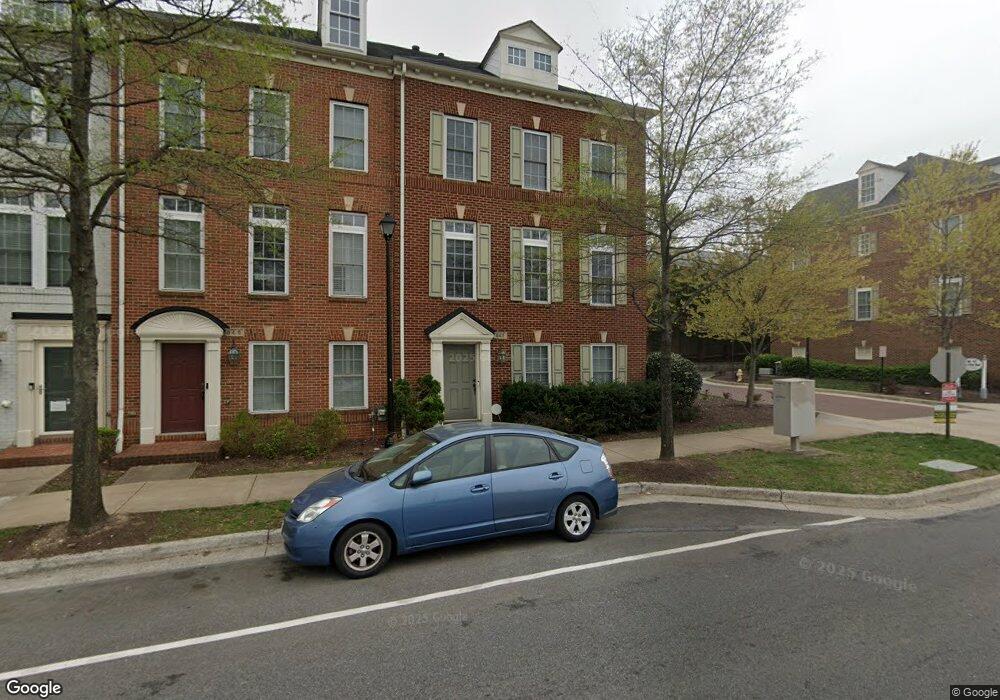
848 W Glebe Rd Alexandria, VA 22305
Beverly Hills NeighborhoodEstimated Value: $812,000 - $919,171
3
Beds
4
Baths
2,418
Sq Ft
$356/Sq Ft
Est. Value
About This Home
This home is located at 848 W Glebe Rd, Alexandria, VA 22305 and is currently estimated at $859,724, approximately $355 per square foot. 848 W Glebe Rd is a home located in Alexandria City with nearby schools including Charles Barrett Elementary School, George Washington Middle School, and Alexandria City High School.
Ownership History
Date
Name
Owned For
Owner Type
Purchase Details
Closed on
Aug 28, 2017
Sold by
Davies Theresa Christine and Davies Nicholas Matthew
Bought by
Davies Nicholas Matthew
Current Estimated Value
Purchase Details
Closed on
May 26, 2011
Sold by
Talley Randy C
Bought by
Davies Nicholas M
Home Financials for this Owner
Home Financials are based on the most recent Mortgage that was taken out on this home.
Original Mortgage
$417,000
Outstanding Balance
$291,618
Interest Rate
4.94%
Mortgage Type
New Conventional
Estimated Equity
$568,106
Purchase Details
Closed on
Oct 6, 2008
Sold by
Nvr Inc
Bought by
Talley Randy Charles
Home Financials for this Owner
Home Financials are based on the most recent Mortgage that was taken out on this home.
Original Mortgage
$442,900
Interest Rate
5.94%
Mortgage Type
New Conventional
Purchase Details
Closed on
Jun 30, 2008
Sold by
Brookfield Glebe Road Llc
Bought by
Nvr Inc
Create a Home Valuation Report for This Property
The Home Valuation Report is an in-depth analysis detailing your home's value as well as a comparison with similar homes in the area
Home Values in the Area
Average Home Value in this Area
Purchase History
| Date | Buyer | Sale Price | Title Company |
|---|---|---|---|
| Davies Nicholas Matthew | -- | None Available | |
| Davies Nicholas M | $555,000 | -- | |
| Talley Randy Charles | $553,680 | -- | |
| Nvr Inc | $1,869,000 | -- |
Source: Public Records
Mortgage History
| Date | Status | Borrower | Loan Amount |
|---|---|---|---|
| Open | Davies Nicholas M | $417,000 | |
| Previous Owner | Talley Randy Charles | $442,900 |
Source: Public Records
Tax History Compared to Growth
Tax History
| Year | Tax Paid | Tax Assessment Tax Assessment Total Assessment is a certain percentage of the fair market value that is determined by local assessors to be the total taxable value of land and additions on the property. | Land | Improvement |
|---|---|---|---|---|
| 2025 | $9,409 | $858,854 | $407,259 | $451,595 |
| 2024 | $9,409 | $817,297 | $387,866 | $429,431 |
| 2023 | $8,652 | $779,433 | $369,396 | $410,037 |
| 2022 | $8,786 | $791,524 | $369,396 | $422,128 |
| 2021 | $7,879 | $709,855 | $332,456 | $377,399 |
| 2020 | $7,593 | $682,256 | $316,039 | $366,217 |
| 2019 | $7,358 | $651,190 | $304,239 | $346,951 |
| 2018 | $7,358 | $651,190 | $304,239 | $346,951 |
| 2017 | $7,194 | $636,632 | $295,004 | $341,628 |
| 2016 | $6,905 | $643,503 | $301,875 | $341,628 |
| 2015 | $6,293 | $603,311 | $301,875 | $301,436 |
| 2014 | $6,061 | $581,095 | $302,848 | $278,247 |
Source: Public Records
Map
Nearby Homes
- 904 W Glebe Rd
- 3836 Brighton Ct
- 464 W Glebe Rd
- 3911 Old Dominion Blvd
- 3941 Old Dominion Blvd
- 1225 Martha Custis Dr Unit 919
- 1225 Martha Custis Dr Unit 819
- 1225 Martha Custis Dr Unit 1116
- 1225 Martha Custis Dr Unit 715
- 1225 Martha Custis Dr Unit 704
- 1225 Martha Custis Dr Unit 203
- 1225 Martha Custis Dr Unit 1016
- 1225 Martha Custis Dr Unit 319
- 1225 Martha Custis Dr Unit 1602
- 3614 Valley Dr
- 1242 Martha Custis Dr
- 3519 Valley Dr
- 3606 Greenway Place
- 3508 Valley Dr
- 2301 25th St S Unit 4306
- 846 W Glebe Rd
- 844 W Glebe Rd
- 842 W Glebe Rd
- 830 W Glebe Rd
- 840 W Glebe Rd
- 900 W Glebe Rd
- 838 W Glebe Rd
- 902 W Glebe Rd
- 701 Tennessee Ave
- 836 W Glebe Rd
- 851 W Glebe Rd
- 906 W Glebe Rd
- 617 Tennessee Ave
- 908 W Glebe Rd
- 615 Tennessee Ave
- 910 W Glebe Rd
- 826 W Glebe Rd
- 613 Tennessee Ave
- 824 W Glebe Rd
- 611 Tennessee Ave