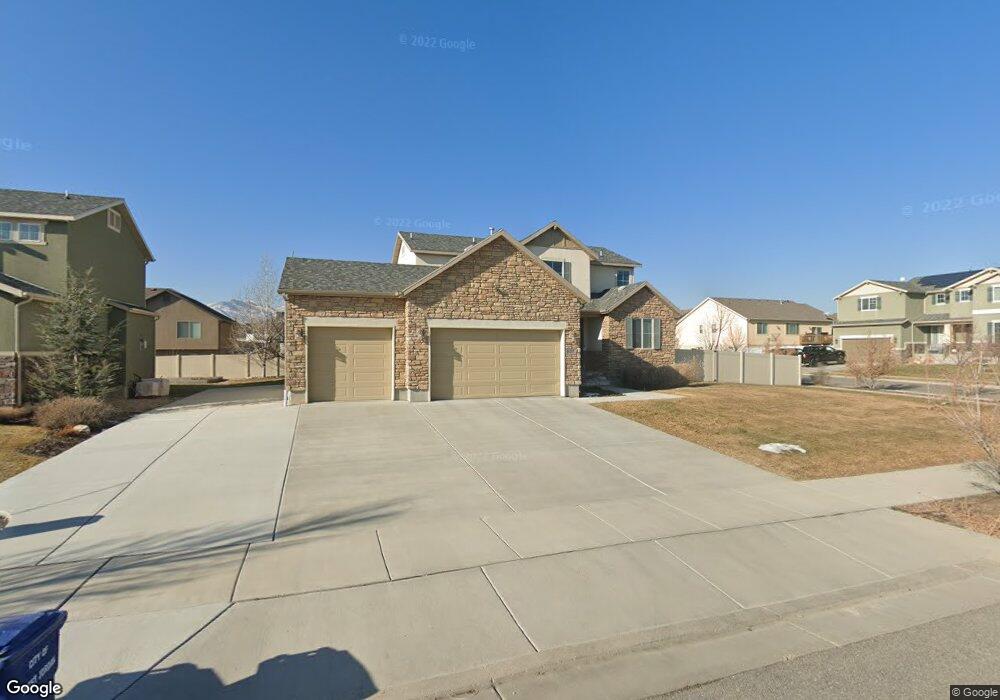
8482 S 6260 W Unit 412 West Jordan, UT 84081
Jordan Hills NeighborhoodEstimated Value: $702,000 - $732,000
4
Beds
4
Baths
3,238
Sq Ft
$223/Sq Ft
Est. Value
About This Home
This home is located at 8482 S 6260 W Unit 412, West Jordan, UT 84081 and is currently estimated at $721,146, approximately $222 per square foot. 8482 S 6260 W Unit 412 is a home located in Salt Lake County with nearby schools including Fox Hollow School, Sunset Ridge Middle School, and Copper Hills High School.
Ownership History
Date
Name
Owned For
Owner Type
Purchase Details
Closed on
Apr 14, 2020
Sold by
Foster Devan T and Foster Maura A
Bought by
Foster Devan Thayne and Foster Maura Allen
Current Estimated Value
Purchase Details
Closed on
Jun 29, 2016
Sold by
Owen Jesse and Owen Sarah
Bought by
Foster Maura A and Foster Devan T
Home Financials for this Owner
Home Financials are based on the most recent Mortgage that was taken out on this home.
Original Mortgage
$300,000
Outstanding Balance
$239,491
Interest Rate
3.58%
Mortgage Type
New Conventional
Estimated Equity
$481,655
Purchase Details
Closed on
Sep 19, 2013
Sold by
Woodside Riverwalk Preserve Llc
Bought by
Owen Jesse and Owen Sarah
Home Financials for this Owner
Home Financials are based on the most recent Mortgage that was taken out on this home.
Original Mortgage
$313,500
Interest Rate
4.36%
Mortgage Type
New Conventional
Create a Home Valuation Report for This Property
The Home Valuation Report is an in-depth analysis detailing your home's value as well as a comparison with similar homes in the area
Home Values in the Area
Average Home Value in this Area
Purchase History
| Date | Buyer | Sale Price | Title Company |
|---|---|---|---|
| Foster Devan Thayne | -- | None Available | |
| Foster Maura A | -- | Title Guarantee S Jordan | |
| Owen Jesse | -- | Us Title |
Source: Public Records
Mortgage History
| Date | Status | Borrower | Loan Amount |
|---|---|---|---|
| Open | Foster Maura A | $300,000 | |
| Previous Owner | Owen Jesse | $313,500 |
Source: Public Records
Tax History Compared to Growth
Tax History
| Year | Tax Paid | Tax Assessment Tax Assessment Total Assessment is a certain percentage of the fair market value that is determined by local assessors to be the total taxable value of land and additions on the property. | Land | Improvement |
|---|---|---|---|---|
| 2025 | $3,472 | $686,400 | $180,000 | $506,400 |
| 2024 | $3,472 | $668,000 | $174,800 | $493,200 |
| 2023 | $3,523 | $638,900 | $168,100 | $470,800 |
| 2022 | $3,659 | $652,700 | $164,800 | $487,900 |
| 2021 | $3,068 | $498,200 | $129,800 | $368,400 |
| 2020 | $2,891 | $440,600 | $129,800 | $310,800 |
| 2019 | $2,901 | $433,500 | $129,800 | $303,700 |
| 2018 | $2,759 | $408,900 | $127,700 | $281,200 |
| 2017 | $2,510 | $370,400 | $127,700 | $242,700 |
| 2016 | $2,465 | $341,800 | $124,600 | $217,200 |
| 2015 | $2,427 | $328,100 | $127,000 | $201,100 |
| 2014 | $2,210 | $297,500 | $115,100 | $182,400 |
Source: Public Records
Map
Nearby Homes
- 8368 S Oak Gate Dr
- 8457 S 6430 W
- 8356 S Four Elm Cir
- 8497 S 6465 W
- 8329 S 6430 W
- Palmdale Plan at Dry Creek Highlands - Cottages
- Creighton Farmhouse Plan at Dry Creek Highlands - Signature
- 8687 S Rock Lake Ct
- Sanders Plan at Dry Creek Highlands - Cottages
- 6568 W Raynolds Peak Way
- Parksdale Plan at Dry Creek Highlands - Cottages
- Palo Verde Plan at Dry Creek Highlands - Cottages
- Vancouver Plan at Dry Creek Highlands - Towns
- Bellevue 2 Plan at Dry Creek Highlands - Towns
- DaVinci Traditional Plan at Dry Creek Highlands - Signature
- 8848 S Veiled Peak Rd
- Sydney Traditional Plan at Dry Creek Highlands - Signature
- Carson Plan at Dry Creek Highlands - Cottages
- 6566 W Raynolds Peak Way
- Pasadena Plan at Dry Creek Highlands - Cottages
- 8482 S 6260 W
- 8498 S 6260 W
- 8483 S Crowsnest Dr
- 8497 S Crowsnest Dr
- 6272 W Spray Lake Dr
- 8481 S 6260 W
- 6258 W Spray Lake Dr
- 6284 W Spray Lake Dr S
- 8499 S 6260 W
- 8512 S 6260 W
- 6246 W Spray Lake Dr
- 8509 S Crowsnest Dr
- 8478 S 6220 W
- 8486 S Crowsnest Dr
- 6269 W Brush Fork Dr Unit LT 328
- 6259 W Brush Fork Dr
- 8437 S Crowsnest Dr
- 8537 Crowsnest Dr
- 8502 S Crowsnest Dr
- 8496 S 6220 W