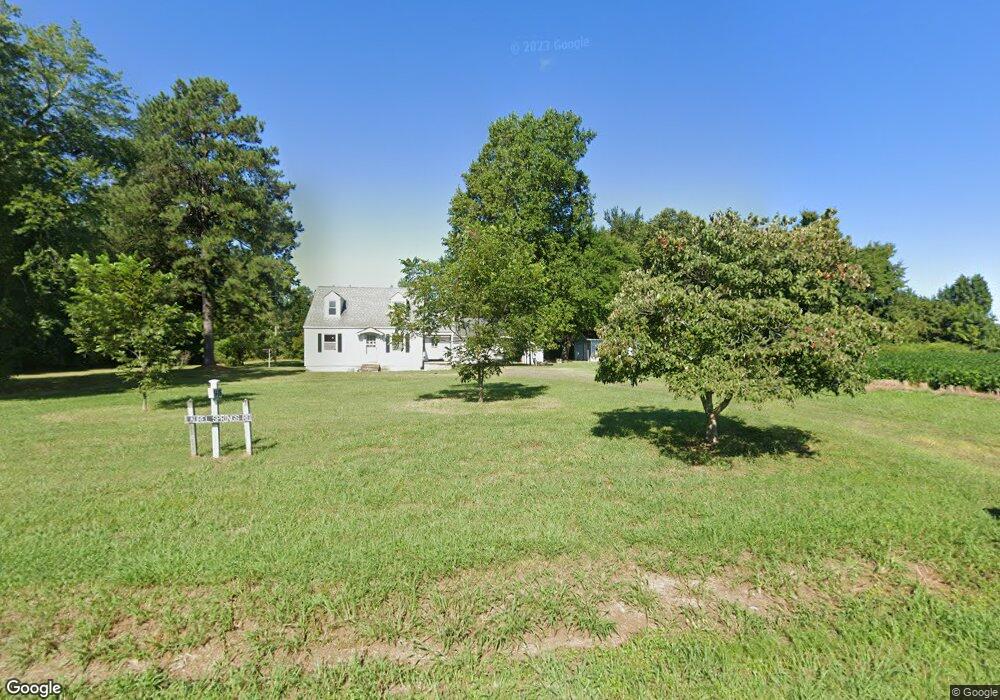
8486 Laurel Springs Rd Disputanta, VA 23842
Estimated Value: $234,000 - $299,232
3
Beds
2
Baths
1,632
Sq Ft
$163/Sq Ft
Est. Value
About This Home
This home is located at 8486 Laurel Springs Rd, Disputanta, VA 23842 and is currently estimated at $266,616, approximately $163 per square foot. 8486 Laurel Springs Rd is a home located in Surry County with nearby schools including Surry Elementary School, Luther P. Jackson Middle School, and Surry County High School.
Ownership History
Date
Name
Owned For
Owner Type
Purchase Details
Closed on
Jun 16, 2023
Sold by
Lofton Leasing Llc
Bought by
Windgate Ii Llc
Current Estimated Value
Purchase Details
Closed on
May 26, 2023
Sold by
James A Evans Attorney At Law Plc
Bought by
Lofton Leasing Llc
Purchase Details
Closed on
Oct 22, 2021
Sold by
Winfree Thomas William
Bought by
Winfree Thomas William and Thomas W Winfree Trust
Purchase Details
Closed on
Dec 20, 2011
Sold by
Wells Louise T
Bought by
Jones Nathan T
Home Financials for this Owner
Home Financials are based on the most recent Mortgage that was taken out on this home.
Original Mortgage
$91,734
Interest Rate
3.87%
Mortgage Type
New Conventional
Create a Home Valuation Report for This Property
The Home Valuation Report is an in-depth analysis detailing your home's value as well as a comparison with similar homes in the area
Home Values in the Area
Average Home Value in this Area
Purchase History
| Date | Buyer | Sale Price | Title Company |
|---|---|---|---|
| Windgate Ii Llc | -- | None Listed On Document | |
| Lofton Leasing Llc | $95,630 | None Listed On Document | |
| Winfree Thomas William | -- | None Listed On Document | |
| Jones Nathan T | $89,900 | Chicago Title Insurance Co |
Source: Public Records
Mortgage History
| Date | Status | Borrower | Loan Amount |
|---|---|---|---|
| Previous Owner | Jones Nathan T | $91,734 |
Source: Public Records
Tax History Compared to Growth
Tax History
| Year | Tax Paid | Tax Assessment Tax Assessment Total Assessment is a certain percentage of the fair market value that is determined by local assessors to be the total taxable value of land and additions on the property. | Land | Improvement |
|---|---|---|---|---|
| 2025 | $2,153 | $303,200 | $42,700 | $260,500 |
| 2024 | $1,703 | $239,800 | $32,800 | $207,000 |
| 2023 | $909 | $128,000 | $26,800 | $101,200 |
| 2022 | $857 | $119,000 | $22,300 | $96,700 |
| 2021 | $813 | $105,600 | $22,300 | $83,300 |
| 2020 | $750 | $105,600 | $22,300 | $83,300 |
| 2019 | $750 | $105,600 | $22,300 | $83,300 |
| 2018 | $750 | $105,600 | $22,300 | $83,300 |
| 2017 | $750 | $105,600 | $22,300 | $83,300 |
| 2016 | $750 | $105,600 | $22,300 | $83,300 |
| 2015 | -- | $108,000 | $22,300 | $85,700 |
| 2014 | -- | $108,000 | $22,300 | $85,700 |
| 2013 | -- | $108,000 | $22,300 | $85,700 |
Source: Public Records
Map
Nearby Homes
- 5153 Laurel Springs Rd
- 14915 Lebanon Rd
- 11325 Webb Rd
- 14995 Lebanon Rd
- 14955 Lebanon Rd
- 15135 Lebanon Rd
- 15205 Lebanon Rd
- 15215 Lebanon Rd
- 15325 Lebanon Rd
- 15335 Lebanon Rd
- Parcel 2A Webb Rd
- 10220 County Dr
- 15085 Lebanon Rd
- TBD James River Dr
- 14511 Arwood Rd
- 00 Lot Rives Rd
- TBD Hollyfield Ln
- Otterdam Rd
- 24178 Cabin Point Rd
- 13512 Queen St