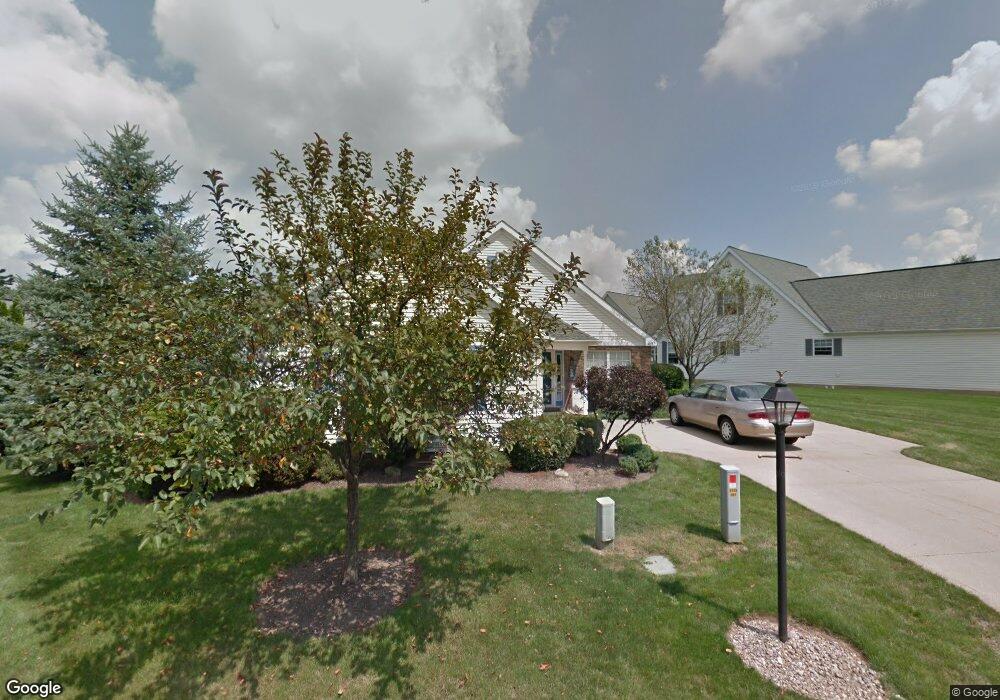
8487 Waterside Dr Northfield, OH 44067
Estimated Value: $269,204 - $293,000
2
Beds
2
Baths
1,388
Sq Ft
$204/Sq Ft
Est. Value
About This Home
This home is located at 8487 Waterside Dr, Northfield, OH 44067 and is currently estimated at $283,551, approximately $204 per square foot. 8487 Waterside Dr is a home located in Summit County with nearby schools including Lee Eaton Elementary School, Nordonia Middle School, and Nordonia High School.
Ownership History
Date
Name
Owned For
Owner Type
Purchase Details
Closed on
Sep 13, 2018
Sold by
Koncal Rita M
Bought by
Smith Jeffrey W and Smith Janice A
Current Estimated Value
Home Financials for this Owner
Home Financials are based on the most recent Mortgage that was taken out on this home.
Original Mortgage
$65,000
Outstanding Balance
$22,717
Interest Rate
4.6%
Mortgage Type
Purchase Money Mortgage
Estimated Equity
$260,834
Purchase Details
Closed on
Aug 6, 2009
Sold by
Koncal Rita M
Bought by
Koncal Rita M and The Koncal Family Revocable Living Trust
Purchase Details
Closed on
May 27, 2009
Sold by
Koncal Rita M
Bought by
Koncal Rita M and The Koncal Family B Trust
Purchase Details
Closed on
Nov 19, 2004
Sold by
Koncal Laddie J and Koncal Rita M
Bought by
Koncal Laddie J and Koncal Rita M
Purchase Details
Closed on
Jul 21, 1995
Sold by
Eaton Estate Building Co
Bought by
Koncal Laddie J and Koncal Rita M
Create a Home Valuation Report for This Property
The Home Valuation Report is an in-depth analysis detailing your home's value as well as a comparison with similar homes in the area
Home Values in the Area
Average Home Value in this Area
Purchase History
| Date | Buyer | Sale Price | Title Company |
|---|---|---|---|
| Smith Jeffrey W | $175,000 | Nova Title Agency Inc | |
| Koncal Rita M | -- | Attorney | |
| Koncal Rita M | -- | Attorney | |
| Koncal Laddie J | -- | -- | |
| Koncal Laddie J | $170,591 | -- |
Source: Public Records
Mortgage History
| Date | Status | Borrower | Loan Amount |
|---|---|---|---|
| Open | Smith Jeffrey W | $65,000 |
Source: Public Records
Tax History Compared to Growth
Tax History
| Year | Tax Paid | Tax Assessment Tax Assessment Total Assessment is a certain percentage of the fair market value that is determined by local assessors to be the total taxable value of land and additions on the property. | Land | Improvement |
|---|---|---|---|---|
| 2025 | $3,120 | $79,832 | $20,318 | $59,514 |
| 2024 | $3,120 | $79,832 | $20,318 | $59,514 |
| 2023 | $3,120 | $79,832 | $20,318 | $59,514 |
| 2022 | $2,669 | $60,022 | $15,274 | $44,748 |
| 2021 | $2,615 | $60,022 | $15,274 | $44,748 |
| 2020 | $2,573 | $60,020 | $15,270 | $44,750 |
| 2019 | $3,051 | $63,000 | $14,510 | $48,490 |
| 2018 | $3,194 | $63,000 | $14,510 | $48,490 |
| 2017 | $2,914 | $63,000 | $14,510 | $48,490 |
| 2016 | $2,915 | $56,710 | $14,510 | $42,200 |
| 2015 | $2,914 | $56,710 | $14,510 | $42,200 |
| 2014 | $2,896 | $56,710 | $14,510 | $42,200 |
| 2013 | $3,194 | $62,200 | $14,510 | $47,690 |
Source: Public Records
Map
Nearby Homes
- 8510 Waterside Dr
- 395 Spring Pond Rd
- 376 Bishop Way
- 340 Pineo Ct
- 8134 N Boyden Rd
- 966 Nesbitt Rd
- 4930 Squire Dr
- 763 Willow Lake Dr
- 8054 Sandstone Dr
- 445 Houghton Rd
- V/L Meadow Ln
- 10306 Electric Blvd
- 7669 Locust Cir
- 7872 French Dr
- 188 Timberlane Dr
- 7840 Carter Rd
- 11768 Valley View Rd
- 1992 Heron Glen Ct
- 8602 Strawbridge Cir
- 8605 Strawbridge Cir
- 8483 Waterside Dr
- 8491 Waterside Dr
- 8479 Waterside Dr
- 8495 Waterside Dr
- 8480 Waterside Dr
- 8482 Waterside Dr
- 8492 Waterside Dr
- 8484 Waterside Dr
- 8478 Waterside Dr
- 8490 Waterside Dr
- 8486 Waterside Dr
- 8488 Waterside Dr
- 8497 Waterside Dr
- 8475 Waterside Dr
- 8494 Waterside Dr
- 8476 Waterside Dr
- 8496 Waterside Dr
- 8474 Waterside Dr
- 8499 Waterside Dr
- 8473 Waterside Dr