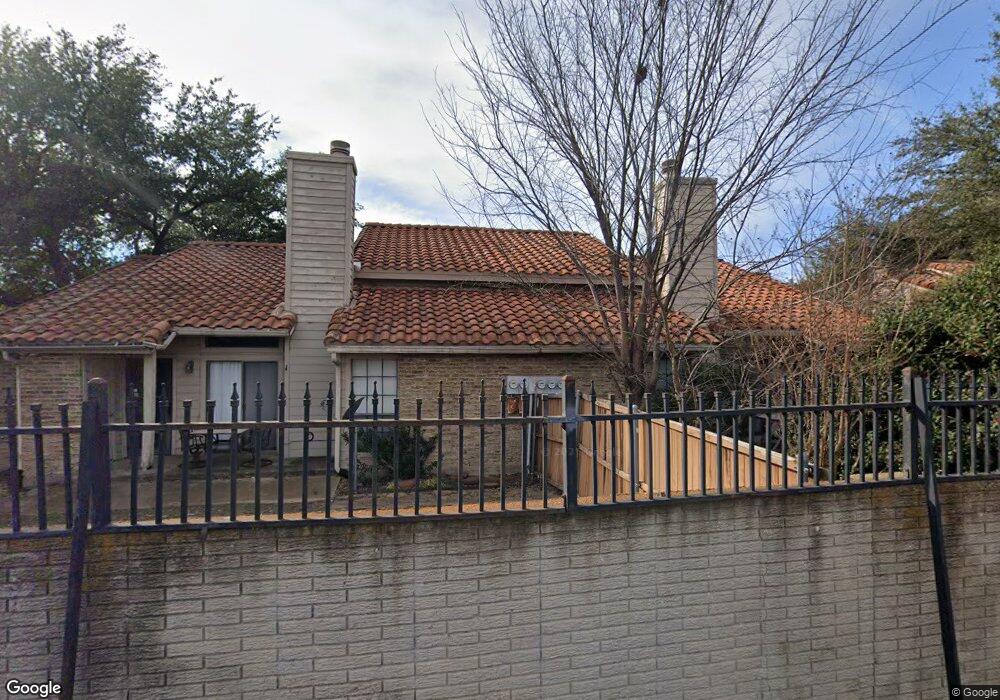
849 Dublin Dr Unit 4 Richardson, TX 75080
Richardson Heights NeighborhoodEstimated Value: $155,000 - $191,000
1
Bed
2
Baths
809
Sq Ft
$211/Sq Ft
Est. Value
About This Home
This home is located at 849 Dublin Dr Unit 4, Richardson, TX 75080 and is currently estimated at $170,848, approximately $211 per square foot. 849 Dublin Dr Unit 4 is a home located in Dallas County with nearby schools including Dover Elementary School, Richardson West Jr. High School, and Richardson High School.
Ownership History
Date
Name
Owned For
Owner Type
Purchase Details
Closed on
May 26, 2009
Sold by
Cameron Deanna Morris and Leopold Deanna Gayle
Bought by
Stanley William
Current Estimated Value
Home Financials for this Owner
Home Financials are based on the most recent Mortgage that was taken out on this home.
Original Mortgage
$66,295
Outstanding Balance
$41,863
Interest Rate
4.76%
Mortgage Type
VA
Estimated Equity
$128,985
Purchase Details
Closed on
Jul 7, 2006
Sold by
Westbrook John
Bought by
Cameron Joshua C and Cameron Ron
Home Financials for this Owner
Home Financials are based on the most recent Mortgage that was taken out on this home.
Original Mortgage
$51,300
Interest Rate
6.67%
Mortgage Type
Purchase Money Mortgage
Purchase Details
Closed on
May 28, 1999
Sold by
Texas Acquisitions
Bought by
Westbrook John
Home Financials for this Owner
Home Financials are based on the most recent Mortgage that was taken out on this home.
Original Mortgage
$43,900
Interest Rate
6.91%
Create a Home Valuation Report for This Property
The Home Valuation Report is an in-depth analysis detailing your home's value as well as a comparison with similar homes in the area
Home Values in the Area
Average Home Value in this Area
Purchase History
| Date | Buyer | Sale Price | Title Company |
|---|---|---|---|
| Stanley William | -- | Reunion Title Co | |
| Stanley William | -- | Reunion Title Co | |
| Cameron Joshua C | -- | None Available | |
| Westbrook John | -- | -- |
Source: Public Records
Mortgage History
| Date | Status | Borrower | Loan Amount |
|---|---|---|---|
| Open | Stanley William | $66,295 | |
| Closed | Stanley William | $66,295 | |
| Previous Owner | Cameron Joshua C | $51,300 | |
| Previous Owner | Westbrook John | $43,900 |
Source: Public Records
Tax History
| Year | Tax Paid | Tax Assessment Tax Assessment Total Assessment is a certain percentage of the fair market value that is determined by local assessors to be the total taxable value of land and additions on the property. | Land | Improvement |
|---|---|---|---|---|
| 2025 | $3,769 | $172,860 | $24,310 | $148,550 |
| 2024 | $3,769 | $172,860 | $24,310 | $148,550 |
| 2023 | $3,769 | $161,800 | $24,310 | $137,490 |
| 2022 | $2,967 | $121,350 | $24,310 | $97,040 |
| 2021 | $2,758 | $105,170 | $24,310 | $80,860 |
| 2020 | $2,808 | $105,170 | $24,310 | $80,860 |
| 2019 | $2,833 | $101,130 | $24,310 | $76,820 |
| 2018 | $2,162 | $80,900 | $9,730 | $71,170 |
| 2017 | $1,836 | $68,770 | $9,730 | $59,040 |
| 2016 | $1,694 | $63,430 | $9,730 | $53,700 |
| 2015 | $1,047 | $56,630 | $9,730 | $46,900 |
| 2014 | $1,047 | $52,590 | $4,860 | $47,730 |
Source: Public Records
Map
Nearby Homes
- 887 Dublin Dr Unit D
- 895 Dublin Dr Unit 4
- 847 Dublin Dr Unit 4
- 883 Dublin Dr Unit B
- 875 Dublin Dr Unit B
- 857 Dublin Dr Unit 2
- 857 Dublin Dr Unit 3
- 871 Dublin Dr Unit D
- 821 Dublin Dr Unit 153
- 821 Dublin Dr Unit 211
- 908 Plaza Ln
- 1207 Ridgeway Dr
- 1214 Colfax Dr
- 1413 Lamp Post Ln
- 706 S Waterview Dr
- 1106 Ridgeway Cir
- 1239 Dalhart Dr
- 8120 Greenhollow Ln
- 500 S Cottonwood Dr
- 506 S Waterview Dr
- 839 Dublin Dr Unit 2
- 883 Dublin Dr Unit 1
- 877 Dublin Dr Unit 4
- 847 Dublin Dr Unit 1
- 883 Dublin Dr Unit 3
- 845 Dublin Dr Unit 1
- 877 Dublin Dr Unit 2
- 839 Dublin Dr Unit 1
- 841 Dublin Dr Unit 3
- 839 Dublin Dr Unit 3
- 877 Dublin Dr Unit 1
- 851 Dublin Dr Unit 4
- 851 Dublin Dr Unit 2
- 851 Dublin Dr Unit 1
- 843 Dublin Dr Unit 4
- 895 Dublin Dr Unit 1
- 881 Dublin Dr Unit 3
- 897 Dublin Dr Unit 4
- 897 Dublin Dr Unit 3
- 897 Dublin Dr Unit 2
Your Personal Tour Guide
Ask me questions while you tour the home.