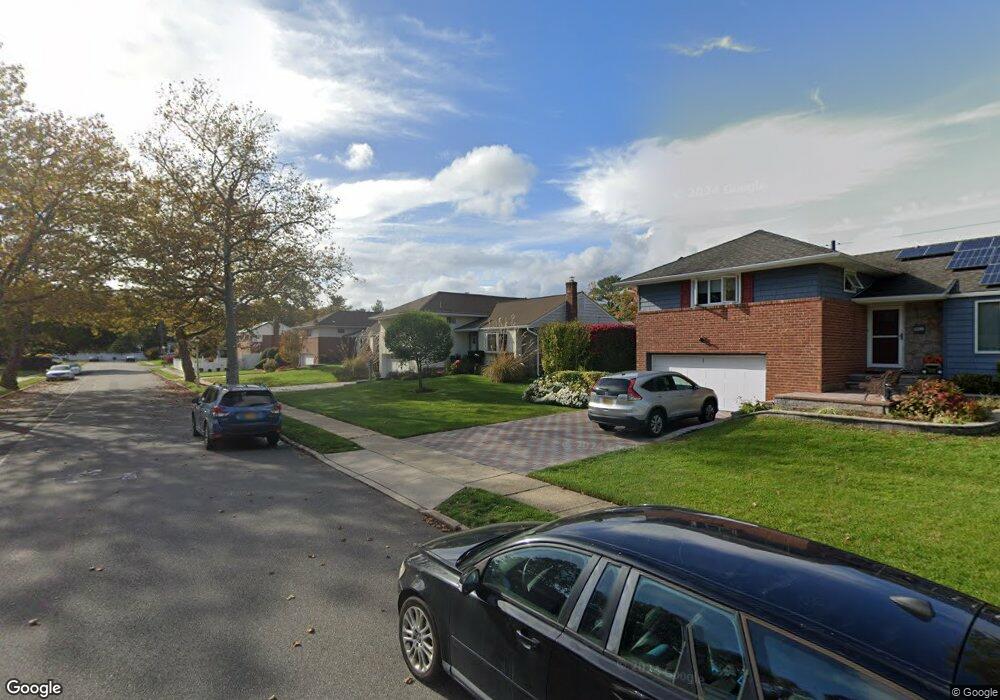
849 Duncan Dr Westbury, NY 11590
Estimated Value: $729,000 - $875,034
3
Beds
2
Baths
1,468
Sq Ft
$546/Sq Ft
Est. Value
About This Home
This home is located at 849 Duncan Dr, Westbury, NY 11590 and is currently estimated at $802,017, approximately $546 per square foot. 849 Duncan Dr is a home located in Nassau County with nearby schools including Westbury High School, Westbury Middle School, and Westbury Friends School.
Ownership History
Date
Name
Owned For
Owner Type
Purchase Details
Closed on
Apr 21, 2011
Sold by
Theodule Ray
Bought by
Mckenzie Judith J
Current Estimated Value
Home Financials for this Owner
Home Financials are based on the most recent Mortgage that was taken out on this home.
Original Mortgage
$282,400
Outstanding Balance
$195,013
Interest Rate
4.82%
Mortgage Type
Purchase Money Mortgage
Estimated Equity
$607,004
Purchase Details
Closed on
Dec 10, 2002
Sold by
Theodule Ray
Purchase Details
Closed on
Jun 19, 1996
Sold by
National Credit Union Adminstr Ation
Bought by
Theodule Ray and Theodule Marie
Home Financials for this Owner
Home Financials are based on the most recent Mortgage that was taken out on this home.
Original Mortgage
$139,500
Interest Rate
7.98%
Purchase Details
Closed on
Jul 19, 1995
Sold by
Duncan Thomas Ref
Bought by
Amalgamated Taxi Federal Credi T Union
Create a Home Valuation Report for This Property
The Home Valuation Report is an in-depth analysis detailing your home's value as well as a comparison with similar homes in the area
Home Values in the Area
Average Home Value in this Area
Purchase History
| Date | Buyer | Sale Price | Title Company |
|---|---|---|---|
| Mckenzie Judith J | $353,000 | -- | |
| -- | -- | -- | |
| Theodule Ray | $155,000 | -- | |
| Amalgamated Taxi Federal Credi T Union | $303,733 | -- |
Source: Public Records
Mortgage History
| Date | Status | Borrower | Loan Amount |
|---|---|---|---|
| Open | Mckenzie Judith J | $282,400 | |
| Previous Owner | Theodule Ray | $139,500 |
Source: Public Records
Tax History Compared to Growth
Tax History
| Year | Tax Paid | Tax Assessment Tax Assessment Total Assessment is a certain percentage of the fair market value that is determined by local assessors to be the total taxable value of land and additions on the property. | Land | Improvement |
|---|---|---|---|---|
| 2025 | $14,068 | $522 | $254 | $268 |
| 2024 | $3,114 | $522 | $254 | $268 |
| 2023 | $14,352 | $522 | $254 | $268 |
| 2022 | $14,352 | $522 | $254 | $268 |
| 2021 | $15,109 | $502 | $244 | $258 |
| 2020 | $15,713 | $899 | $512 | $387 |
| 2019 | $15,515 | $899 | $512 | $387 |
| 2018 | $14,355 | $899 | $0 | $0 |
| 2017 | $10,731 | $899 | $512 | $387 |
| 2016 | $13,484 | $899 | $512 | $387 |
| 2015 | $2,644 | $899 | $501 | $398 |
| 2014 | $2,644 | $899 | $501 | $398 |
| 2013 | $2,498 | $899 | $512 | $387 |
Source: Public Records
Map
Nearby Homes
- 64 Jane Ct
- 830 Jericho Turnpike
- 827 Eastfield Rd
- 49 Middlecamp Rd
- 806 Pepperidge Rd
- 809 Eastfield Rd
- 58 Sudbury Ln
- 922 Brush Hollow Rd
- 101 Hillary Ln
- 11 Parkwood Rd
- 23 Glen Rd
- 508 Alicia Dr
- 5 Orient Ct
- 635 Rockland St
- 26 Saint Andrews Ct
- 39 4th Ave
- 7 Mindy Ln
- 523 Cambridge Ave
- 43 Briarcliff Rd
- 546 Advent St