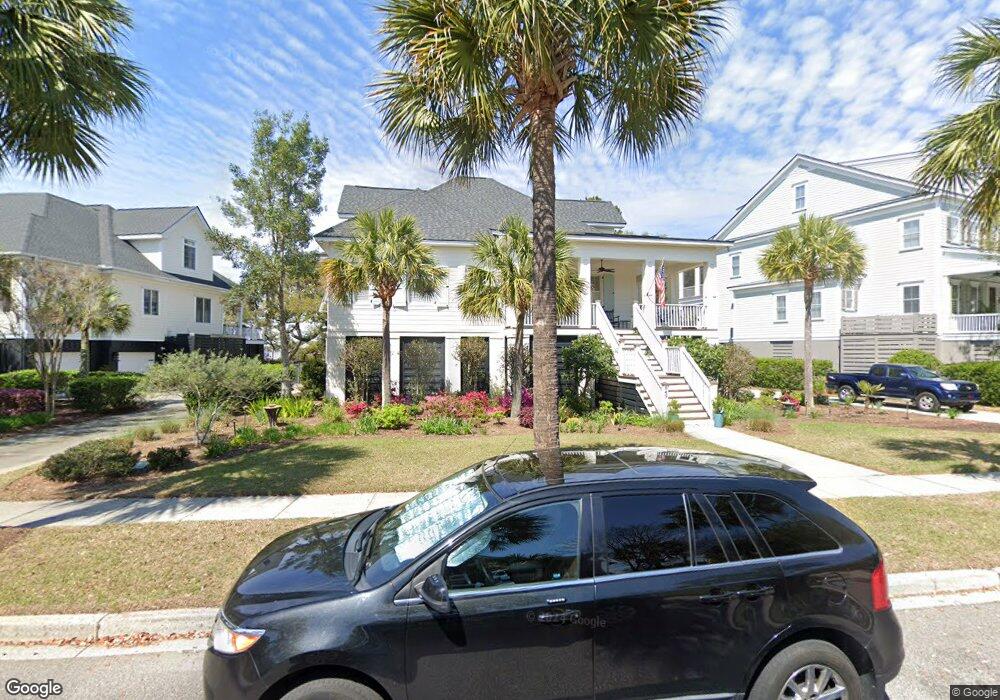
849 Dunham St Daniel Island, SC 29492
Daniel Island NeighborhoodEstimated Value: $1,971,000 - $2,432,000
4
Beds
4
Baths
3,900
Sq Ft
$564/Sq Ft
Est. Value
About This Home
This home is located at 849 Dunham St, Daniel Island, SC 29492 and is currently estimated at $2,198,715, approximately $563 per square foot. 849 Dunham St is a home located in Berkeley County with nearby schools including Daniel Island School and Bishop England High School.
Ownership History
Date
Name
Owned For
Owner Type
Purchase Details
Closed on
May 2, 2016
Sold by
Nelson Mark A and Nelson Anne Meredith
Bought by
Price William G and Price Linda Mcwey
Current Estimated Value
Purchase Details
Closed on
Oct 26, 2009
Sold by
Nelson Mark A and Mitchell Anne M
Bought by
Nelson Mark A and Nelson Anne Meredith
Home Financials for this Owner
Home Financials are based on the most recent Mortgage that was taken out on this home.
Original Mortgage
$603,000
Interest Rate
4.55%
Mortgage Type
Future Advance Clause Open End Mortgage
Purchase Details
Closed on
May 17, 2004
Sold by
Passailaigue Homes Inc
Bought by
Nelson Mark A and Mitchell Anne M
Purchase Details
Closed on
Nov 30, 2001
Sold by
Passailaigue Homes Inc
Bought by
Keller Matthew J and Keller Pamela J
Purchase Details
Closed on
Oct 15, 2001
Sold by
Daniel Island Associates Llc
Bought by
Passailaigue Homes Inc
Create a Home Valuation Report for This Property
The Home Valuation Report is an in-depth analysis detailing your home's value as well as a comparison with similar homes in the area
Home Values in the Area
Average Home Value in this Area
Purchase History
| Date | Buyer | Sale Price | Title Company |
|---|---|---|---|
| Price William G | $892,500 | -- | |
| Nelson Mark A | -- | -- | |
| Nelson Mark A | $800,000 | -- | |
| Keller Matthew J | $145,000 | -- | |
| Passailaigue Homes Inc | $1,470,000 | -- |
Source: Public Records
Mortgage History
| Date | Status | Borrower | Loan Amount |
|---|---|---|---|
| Previous Owner | Nelson Mark A | $603,000 |
Source: Public Records
Tax History
| Year | Tax Paid | Tax Assessment Tax Assessment Total Assessment is a certain percentage of the fair market value that is determined by local assessors to be the total taxable value of land and additions on the property. | Land | Improvement |
|---|---|---|---|---|
| 2025 | $6,820 | $1,112,100 | $578,879 | $533,221 |
| 2024 | $6,797 | $44,484 | $23,155 | $21,329 |
| 2023 | $6,797 | $43,884 | $22,998 | $20,886 |
| 2022 | $6,185 | $38,160 | $10,080 | $28,080 |
| 2021 | $6,298 | $38,160 | $10,080 | $28,080 |
| 2020 | $6,427 | $38,160 | $10,080 | $28,080 |
| 2019 | $6,548 | $38,160 | $10,080 | $28,080 |
| 2018 | $6,480 | $35,756 | $9,360 | $26,396 |
| 2017 | $6,469 | $35,756 | $9,360 | $26,396 |
| 2016 | $5,905 | $53,980 | $14,040 | $39,940 |
| 2015 | $5,514 | $32,140 | $13,220 | $18,920 |
| 2014 | $5,507 | $32,140 | $13,220 | $18,920 |
| 2013 | -- | $32,140 | $13,220 | $18,920 |
Source: Public Records
Map
Nearby Homes
- 926 Cochran St
- 861 Dunham St
- 704 Netherton Ct
- 407 Milner Ct
- 201 N Ladd Ct
- 178 Beresford Creek St
- 102 Bellinger St
- 113 Lucia St
- 122 Collins Hill Ln
- 118 Collins Hill Ln
- 287 Beresford Creek St
- 186 Cartright St
- 150 Brady St
- 118 Scott St
- 331 Megans Bay Ln
- 0 Haswell St
- 309 Megans Bay Ln
- 303 Megans Bay Ln
- 214 Clouter Creek Dr
- 542 Amalie Farms Dr
Your Personal Tour Guide
Ask me questions while you tour the home.