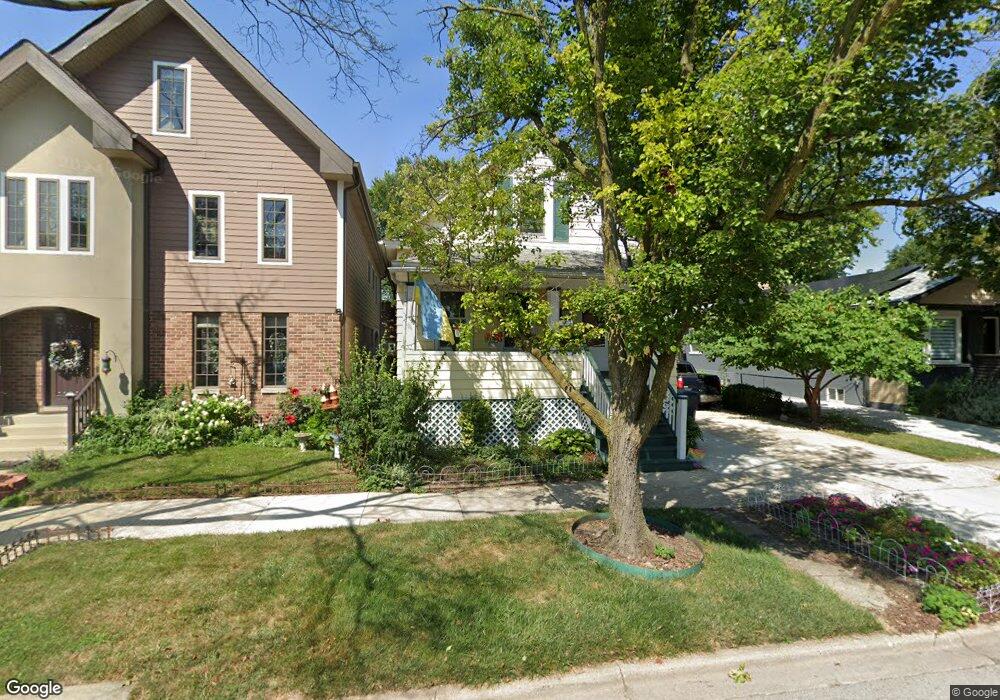
849 Dunlop Ave Forest Park, IL 60130
Estimated Value: $352,945 - $397,000
3
Beds
1
Bath
1,122
Sq Ft
$336/Sq Ft
Est. Value
About This Home
This home is located at 849 Dunlop Ave, Forest Park, IL 60130 and is currently estimated at $377,236, approximately $336 per square foot. 849 Dunlop Ave is a home located in Cook County with nearby schools including Garfield Elementary School, Field Stevenson Elementary School, and Betsy Ross Elementary School.
Ownership History
Date
Name
Owned For
Owner Type
Purchase Details
Closed on
Dec 28, 1999
Sold by
Murphy Michael T
Bought by
Murphy Anne Marie
Current Estimated Value
Home Financials for this Owner
Home Financials are based on the most recent Mortgage that was taken out on this home.
Original Mortgage
$121,500
Outstanding Balance
$38,371
Interest Rate
7.76%
Estimated Equity
$338,865
Purchase Details
Closed on
Jan 7, 1998
Sold by
Murphy Laurel A and Stone Laurel A
Bought by
Murphy Michael T
Home Financials for this Owner
Home Financials are based on the most recent Mortgage that was taken out on this home.
Original Mortgage
$95,000
Interest Rate
7.24%
Purchase Details
Closed on
Aug 29, 1995
Sold by
Cushing Paul Thomas and Cushing Joan
Bought by
Murphy Michael T and Stone Laurel A
Home Financials for this Owner
Home Financials are based on the most recent Mortgage that was taken out on this home.
Original Mortgage
$94,750
Interest Rate
7.5%
Create a Home Valuation Report for This Property
The Home Valuation Report is an in-depth analysis detailing your home's value as well as a comparison with similar homes in the area
Home Values in the Area
Average Home Value in this Area
Purchase History
| Date | Buyer | Sale Price | Title Company |
|---|---|---|---|
| Murphy Anne Marie | $135,000 | -- | |
| Murphy Michael T | -- | -- | |
| Murphy Michael T | $100,000 | -- |
Source: Public Records
Mortgage History
| Date | Status | Borrower | Loan Amount |
|---|---|---|---|
| Open | Murphy Anne Marie | $121,500 | |
| Closed | Murphy Michael T | $95,000 | |
| Closed | Murphy Michael T | $94,750 |
Source: Public Records
Tax History Compared to Growth
Tax History
| Year | Tax Paid | Tax Assessment Tax Assessment Total Assessment is a certain percentage of the fair market value that is determined by local assessors to be the total taxable value of land and additions on the property. | Land | Improvement |
|---|---|---|---|---|
| 2024 | $2,175 | $32,000 | $3,557 | $28,443 |
| 2023 | $2,678 | $32,000 | $3,557 | $28,443 |
| 2022 | $2,678 | $21,861 | $2,727 | $19,134 |
| 2021 | $2,477 | $21,861 | $2,727 | $19,134 |
| 2020 | $2,248 | $21,861 | $2,727 | $19,134 |
| 2019 | $2,638 | $20,059 | $2,490 | $17,569 |
| 2018 | $2,588 | $20,059 | $2,490 | $17,569 |
| 2017 | $2,487 | $20,059 | $2,490 | $17,569 |
| 2016 | $3,559 | $14,931 | $2,252 | $12,679 |
| 2015 | $3,681 | $14,931 | $2,252 | $12,679 |
| 2014 | $3,643 | $14,931 | $2,252 | $12,679 |
| 2013 | $4,217 | $17,545 | $2,252 | $15,293 |
Source: Public Records
Map
Nearby Homes
- 900 Dunlop Ave
- 940 Troost Ave
- 900 Lathrop Ave
- 915 Ferdinand Ave
- 1008 Lathrop Ave
- 1007 Ferdinand Ave
- 1013 Ferdinand Ave
- 944 Beloit Ave Unit 4
- 944 Beloit Ave Unit 5
- 944 Beloit Ave Unit 1
- 944 Beloit Ave Unit 2
- 1024 Ferdinand Ave
- 7742 Taylor St
- 827 Thomas Ave
- 812 Thomas Ave Unit 5
- 1115 Ferdinand Ave
- 613 Ferdinand Ave
- 1124 Lathrop Ave
- 836 Circle Ave
- 1118 Thomas Ave
- 845 Dunlop Ave
- 901 Dunlop Ave
- 850 Des Plaines Ave Unit 210
- 850 Des Plaines Ave Unit 109
- 850 Des Plaines Ave Unit 602
- 850 Des Plaines Ave Unit 706
- 850 Des Plaines Ave Unit 609
- 850 Des Plaines Ave Unit 605
- 850 Des Plaines Ave Unit 501
- 850 Des Plaines Ave Unit 205
- 850 Des Plaines Ave Unit 702
- 850 Des Plaines Ave Unit 709
- 850 Des Plaines Ave Unit 208
- 850 Des Plaines Ave Unit 509
- 850 Des Plaines Ave Unit 409
- 850 Des Plaines Ave Unit 406
- 850 Des Plaines Ave Unit 308
- 850 Des Plaines Ave Unit 606
- 850 Des Plaines Ave Unit 303
- 850 Des Plaines Ave Unit 710