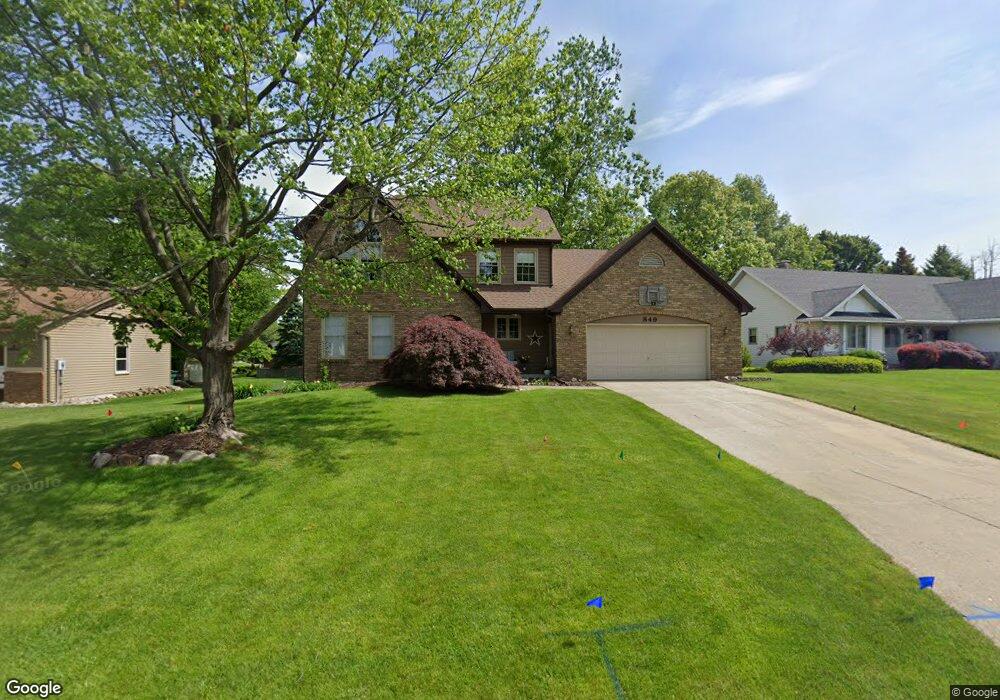
849 E Crownpointe Ct SW Byron Center, MI 49315
Estimated Value: $451,000 - $532,000
3
Beds
3
Baths
1,988
Sq Ft
$242/Sq Ft
Est. Value
About This Home
This home is located at 849 E Crownpointe Ct SW, Byron Center, MI 49315 and is currently estimated at $481,897, approximately $242 per square foot. 849 E Crownpointe Ct SW is a home located in Kent County with nearby schools including Marshall Elementary School, Robert L. Nickels Intermediate School, and Byron Center West Middle School.
Ownership History
Date
Name
Owned For
Owner Type
Purchase Details
Closed on
Jun 25, 2010
Sold by
Kaminski Linda S and Linda S Kaminski Trust
Bought by
Kaminski Linda S
Current Estimated Value
Home Financials for this Owner
Home Financials are based on the most recent Mortgage that was taken out on this home.
Original Mortgage
$35,300
Interest Rate
4.77%
Mortgage Type
New Conventional
Purchase Details
Closed on
May 4, 2007
Sold by
Kaminski Linda S
Bought by
Linda S Kaminski Trust
Home Financials for this Owner
Home Financials are based on the most recent Mortgage that was taken out on this home.
Original Mortgage
$40,000
Interest Rate
5.75%
Mortgage Type
Credit Line Revolving
Purchase Details
Closed on
May 12, 2006
Sold by
Kaminski Linda S
Bought by
The Linda S Kaminski Trust
Create a Home Valuation Report for This Property
The Home Valuation Report is an in-depth analysis detailing your home's value as well as a comparison with similar homes in the area
Home Values in the Area
Average Home Value in this Area
Purchase History
| Date | Buyer | Sale Price | Title Company |
|---|---|---|---|
| Kaminski Linda S | -- | None Available | |
| The Linda S Kaminski Trust | -- | None Available | |
| Linda S Kaminski Trust | -- | None Available | |
| Kaminski Linda S | -- | Fiserv Lending Solutions | |
| The Linda S Kaminski Trust | -- | None Available | |
| Kaminski Linda S | -- | None Available |
Source: Public Records
Mortgage History
| Date | Status | Borrower | Loan Amount |
|---|---|---|---|
| Closed | Kaminski Linda S | $35,300 | |
| Previous Owner | Kaminski Linda S | $40,000 |
Source: Public Records
Tax History Compared to Growth
Tax History
| Year | Tax Paid | Tax Assessment Tax Assessment Total Assessment is a certain percentage of the fair market value that is determined by local assessors to be the total taxable value of land and additions on the property. | Land | Improvement |
|---|---|---|---|---|
| 2025 | $2,492 | $227,800 | $0 | $0 |
| 2024 | $2,492 | $206,300 | $0 | $0 |
| 2023 | $2,383 | $183,200 | $0 | $0 |
| 2022 | $3,322 | $160,800 | $0 | $0 |
| 2021 | $3,233 | $148,500 | $0 | $0 |
| 2020 | $2,194 | $135,000 | $0 | $0 |
| 2019 | $3,155 | $130,500 | $0 | $0 |
| 2018 | $3,090 | $123,000 | $20,000 | $103,000 |
| 2017 | $3,006 | $110,300 | $0 | $0 |
| 2016 | $2,899 | $104,700 | $0 | $0 |
| 2015 | $2,849 | $104,700 | $0 | $0 |
| 2013 | -- | $92,700 | $0 | $0 |
Source: Public Records
Map
Nearby Homes
- 6540 Kingtree Dr SW
- 6696 Highmeadow Dr SW
- 1010 Bellview Meadow Dr SW Unit 68
- 1012 Bellview Meadow Dr SW
- 1171 Runway Place SW
- 907 Amber View Dr SW
- 825 Amber Ridge Dr SW
- 6455 Silverton Dr
- 6787 Sunfield Dr SW
- 1058 Amberwood West Dr SW
- 924 Amberwood West Dr SW
- 6450 Estate Dr SW
- 323 Scabbard St SW
- 6471 Estate Dr SW
- 6455 Estate Dr SW
- 906 60th St SW
- 369 N Harewood Dr SW
- 270 S Edinberg Dr SW
- 6745 Buchanan Ave SW
- 1493 Dexter Dr SW Unit 34
- 861 E Crownpointe Ct SW
- 837 E Crownpointe Ct SW
- 6552 Crownpointe Dr SW
- 6560 Crownpointe Dr SW
- 6546 Crownpointe Dr SW
- 831 E Crownpointe Ct SW
- 875 E Crownpointe Ct SW
- 6534 Crownpointe Dr SW
- 6524 Crownpointe Dr SW
- 827 E Crownpointe Ct SW
- 850 E Crownpointe Ct SW
- 860 E Crownpointe Ct SW
- 874 E Crownpointe Ct SW
- 836 E Crownpointe Ct SW
- 899 E Crownpointe Ct SW
- 830 E Crownpointe Ct SW
- 6610 Crownpointe Dr SW
- 6565 Crownpointe Dr SW
- 6553 Crownpointe Dr SW
- 6545 Crownpointe Dr SW