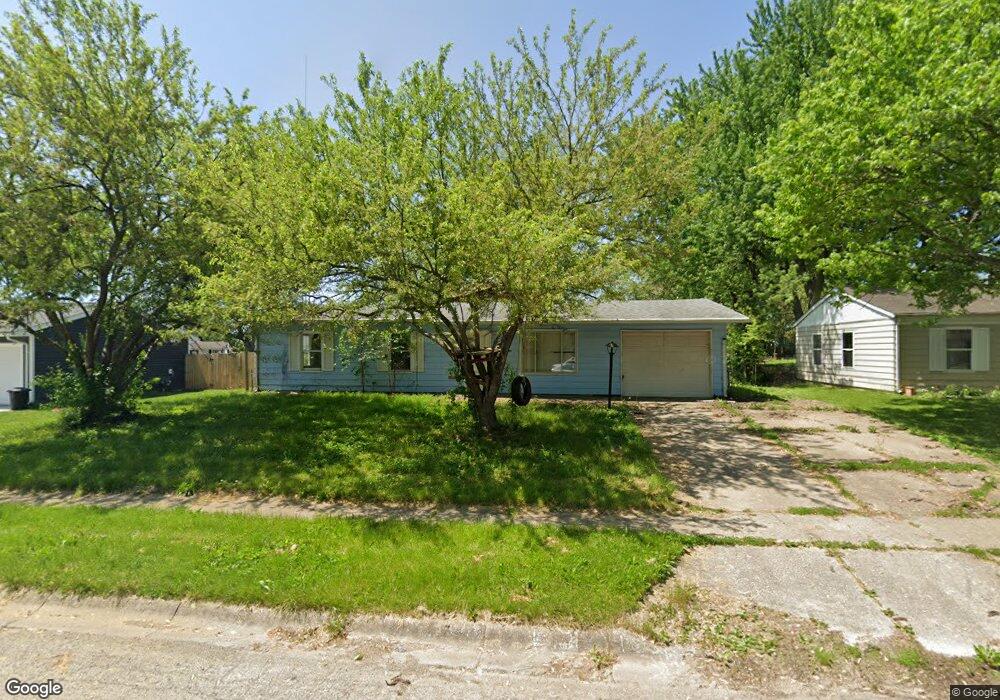
849 Edgewick Rd New Carlisle, OH 45344
Estimated Value: $135,000 - $161,000
3
Beds
2
Baths
1,025
Sq Ft
$146/Sq Ft
Est. Value
About This Home
This home is located at 849 Edgewick Rd, New Carlisle, OH 45344 and is currently estimated at $150,004, approximately $146 per square foot. 849 Edgewick Rd is a home located in Clark County with nearby schools including Park Layne Elementary School, New Carlisle Elementary School, and Donnelsville Elementary School.
Ownership History
Date
Name
Owned For
Owner Type
Purchase Details
Closed on
Mar 1, 2007
Sold by
Fannie Mae
Bought by
Real Estate Investors Place Llc
Current Estimated Value
Purchase Details
Closed on
Apr 14, 2006
Sold by
Gross Thomas S
Bought by
Federal National Mortgage Association
Purchase Details
Closed on
Jun 21, 1995
Sold by
Simpson Brian W
Bought by
Gross Thomas S
Home Financials for this Owner
Home Financials are based on the most recent Mortgage that was taken out on this home.
Original Mortgage
$70,740
Interest Rate
7.9%
Mortgage Type
New Conventional
Purchase Details
Closed on
May 30, 1989
Create a Home Valuation Report for This Property
The Home Valuation Report is an in-depth analysis detailing your home's value as well as a comparison with similar homes in the area
Home Values in the Area
Average Home Value in this Area
Purchase History
| Date | Buyer | Sale Price | Title Company |
|---|---|---|---|
| Real Estate Investors Place Llc | $61,800 | Title First Agency | |
| Federal National Mortgage Association | $57,000 | None Available | |
| Gross Thomas S | $70,740 | -- | |
| -- | $51,000 | -- |
Source: Public Records
Mortgage History
| Date | Status | Borrower | Loan Amount |
|---|---|---|---|
| Previous Owner | Gross Thomas S | $70,740 |
Source: Public Records
Tax History Compared to Growth
Tax History
| Year | Tax Paid | Tax Assessment Tax Assessment Total Assessment is a certain percentage of the fair market value that is determined by local assessors to be the total taxable value of land and additions on the property. | Land | Improvement |
|---|---|---|---|---|
| 2024 | $6,170 | $33,400 | $7,260 | $26,140 |
| 2023 | $4,356 | $33,400 | $7,260 | $26,140 |
| 2022 | $15,005 | $33,400 | $7,260 | $26,140 |
| 2021 | $1,527 | $27,910 | $5,540 | $22,370 |
| 2020 | $1,531 | $27,910 | $5,540 | $22,370 |
| 2019 | $1,514 | $27,910 | $5,540 | $22,370 |
| 2018 | $1,390 | $23,560 | $5,390 | $18,170 |
| 2017 | $1,382 | $22,908 | $5,394 | $17,514 |
| 2016 | $1,326 | $22,908 | $5,394 | $17,514 |
| 2015 | $5,999 | $22,554 | $5,040 | $17,514 |
| 2014 | $1,261 | $22,554 | $5,040 | $17,514 |
| 2013 | $1,109 | $22,554 | $5,040 | $17,514 |
Source: Public Records
Map
Nearby Homes
- 842 Edgewick Rd
- 1689 Dale Ridge Rd
- 634 Bowser Dr
- 212 Monroe Way
- 209 Monroe Way
- 12165 Dille Rd
- 419 E Carpenter Dr
- 819 Hedwick St
- 1037 Frayne Dr
- 0 Kennedy Rd
- 16 Laurel Rd
- 9892 S Palmer Rd
- 0 N Dayton-Lakeview Rd Unit 944532
- 0 N Dayton-Lakeview Rd Unit 1041631
- 11315 W National Rd
- 11501 Zeller Dr
- 9705 E Haskett Ln
- 1292 Medway New Carlisle Rd
- 738 S Medway Carlisle Rd
- 232 E Main St
- 857 Edgewick Rd
- 841 Edgewick Rd
- 1656 Lundgren Rd
- 865 Edgewick Rd
- 1666 Lundgren Rd
- 848 Edgewick Rd
- 856 Edgewick Rd
- 864 Edgewick Rd
- 1676 Lundgren Rd
- 836 Edgewick Rd
- 1651 Lundgren Rd
- 871 Edgewick Rd
- 827 Edgewick Rd
- 1659 Lundgren Rd
- 1684 Lundgren Rd
- 1625 Lambers Dr
- 828 Edgewick Rd
- 863 Cliffside Dr
- 1665 Lundgren Rd
- 857 Cliffside Dr