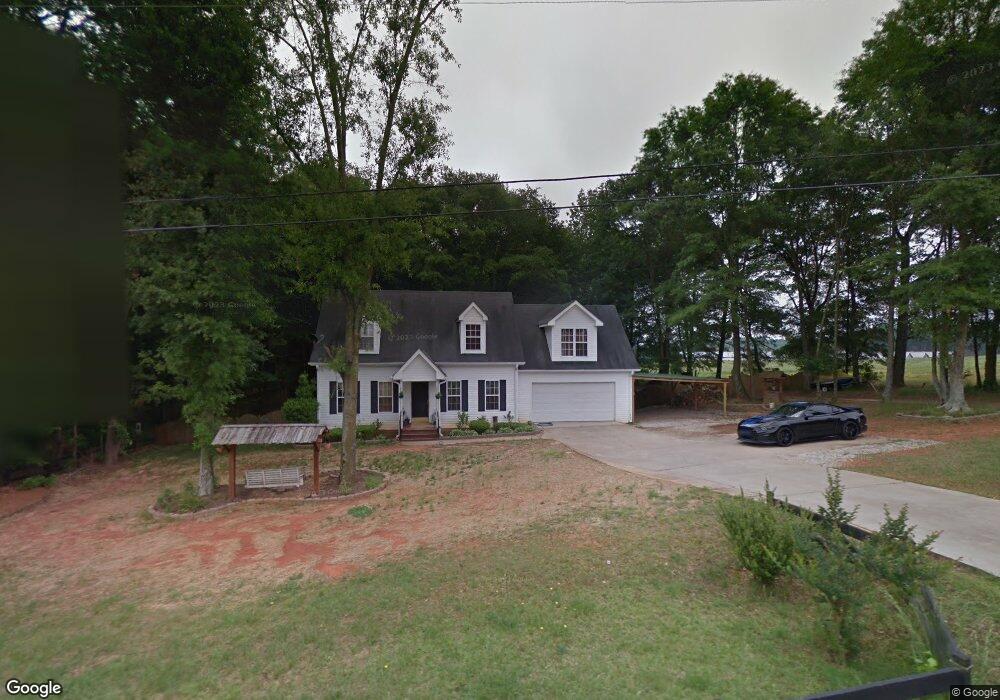
849 Hancock Bridge Rd Winder, GA 30680
Estimated Value: $310,326 - $342,000
3
Beds
3
Baths
1,466
Sq Ft
$221/Sq Ft
Est. Value
About This Home
This home is located at 849 Hancock Bridge Rd, Winder, GA 30680 and is currently estimated at $323,332, approximately $220 per square foot. 849 Hancock Bridge Rd is a home located in Barrow County with nearby schools including Holsenbeck Elementary School, Bear Creek Middle School, and Winder-Barrow High School.
Ownership History
Date
Name
Owned For
Owner Type
Purchase Details
Closed on
Mar 5, 2004
Sold by
Hunter-Frost Inc
Bought by
Morales Leonor B
Current Estimated Value
Home Financials for this Owner
Home Financials are based on the most recent Mortgage that was taken out on this home.
Original Mortgage
$112,423
Outstanding Balance
$52,357
Interest Rate
5.62%
Mortgage Type
New Conventional
Estimated Equity
$270,975
Purchase Details
Closed on
Feb 17, 2004
Sold by
Sailors
Bought by
Hunter-Frost Inc
Home Financials for this Owner
Home Financials are based on the most recent Mortgage that was taken out on this home.
Original Mortgage
$112,423
Outstanding Balance
$52,357
Interest Rate
5.62%
Mortgage Type
New Conventional
Estimated Equity
$270,975
Purchase Details
Closed on
Sep 30, 2002
Bought by
Hunter-Frost Inc
Create a Home Valuation Report for This Property
The Home Valuation Report is an in-depth analysis detailing your home's value as well as a comparison with similar homes in the area
Home Values in the Area
Average Home Value in this Area
Purchase History
| Date | Buyer | Sale Price | Title Company |
|---|---|---|---|
| Morales Leonor B | $115,900 | -- | |
| Hunter-Frost Inc | $30,000 | -- | |
| Hunter-Frost Inc | $26,500 | -- |
Source: Public Records
Mortgage History
| Date | Status | Borrower | Loan Amount |
|---|---|---|---|
| Open | Morales Leonor B | $112,423 | |
| Closed | Hunter-Frost Inc | $100,000 |
Source: Public Records
Tax History Compared to Growth
Tax History
| Year | Tax Paid | Tax Assessment Tax Assessment Total Assessment is a certain percentage of the fair market value that is determined by local assessors to be the total taxable value of land and additions on the property. | Land | Improvement |
|---|---|---|---|---|
| 2024 | $2,018 | $81,415 | $18,000 | $63,415 |
| 2023 | $2,007 | $81,415 | $18,000 | $63,415 |
| 2022 | $1,727 | $60,006 | $18,000 | $42,006 |
| 2021 | $1,600 | $52,539 | $14,000 | $38,539 |
| 2020 | $1,442 | $47,072 | $12,000 | $35,072 |
| 2019 | $1,384 | $44,326 | $12,000 | $32,326 |
| 2018 | $1,365 | $44,326 | $12,000 | $32,326 |
| 2017 | $1,158 | $39,786 | $12,000 | $27,786 |
| 2016 | $1,227 | $40,097 | $12,000 | $28,097 |
| 2015 | $1,242 | $40,408 | $12,000 | $28,408 |
| 2014 | $1,103 | $34,599 | $5,880 | $28,719 |
| 2013 | -- | $33,195 | $5,880 | $27,315 |
Source: Public Records
Map
Nearby Homes
- 0 Hancock Bridge Rd Unit 10535063
- 63 Delightful Way Unit 1
- 162 Delightful Way Unit 28
- 203 Delightful Way Unit 5
- 230 Delightful Way Unit 23
- 253 Delightful Way Unit 6
- 281 Delightful Way Unit 7
- 296 Delightful Way Unit 22
- 508 Pleasant Hill Church Rd NE
- 1556 Shoal Creek Dr
- 1553 Shoal Creek Dr
- 388 Kay Dr Unit 1
- 1206 Corkybrooke Ln
- 1328 Jefferson Hwy
- 867 Windward Rd
- 917 Justin Dr Unit 3
- 1212 Highway 211 NE
- 1226 Highway 211 NE
- 173 Equestrian Walk
- 212 Rainbow Ln
- 853 Hancock Bridge Rd
- 844 Hancock Bridge Rd
- 852 Hancock Bridge Rd
- 642 Pleasant Hill Church Rd NE
- 632 Pleasant Hill Church Rd NE
- 854 Hancock Bridge Rd
- 624 Pleasant Hill Church Rd NE
- 856 Hancock Bridge Rd
- 838 Hancock Bridge Rd
- 664 Pleasant Hill Church Rd NE
- 670 Pleasant Hill Church Rd NE
- 866 Hancock Bridge Rd
- 674 Pleasant Hill Church Rd NE
- 0 Hancock Bridge Rd Unit 7076123
- 0 Hancock Bridge Rd Unit 7017516
- 0 Hancock Bridge Rd Unit 3218885
- 0 Hancock Bridge Rd Unit 7297137
- 0 Hancock Bridge Rd Unit 8704240
- 0 Hancock Bridge Rd Unit 8724737
- 872 Hancock Bridge Rd