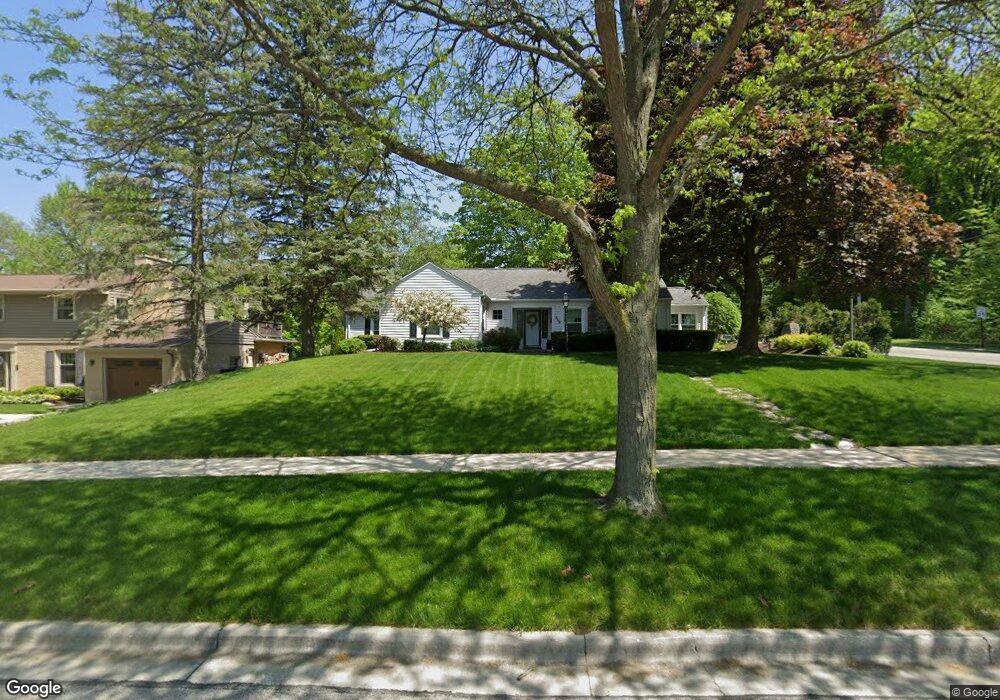
849 Highlandview Dr West Bend, WI 53095
Estimated Value: $357,768 - $442,000
3
Beds
2
Baths
1,687
Sq Ft
$233/Sq Ft
Est. Value
About This Home
This home is located at 849 Highlandview Dr, West Bend, WI 53095 and is currently estimated at $393,442, approximately $233 per square foot. 849 Highlandview Dr is a home located in Washington County with nearby schools including McLane Elementary School, Badger Middle School, and East High School.
Ownership History
Date
Name
Owned For
Owner Type
Purchase Details
Closed on
Aug 7, 2015
Sold by
Devenport Brian C
Bought by
Poock Jennifer A
Current Estimated Value
Purchase Details
Closed on
Jun 15, 2009
Sold by
Weiss Thomas J and Weiss Joan M
Bought by
Devenport Brian C
Home Financials for this Owner
Home Financials are based on the most recent Mortgage that was taken out on this home.
Original Mortgage
$191,700
Interest Rate
4.92%
Mortgage Type
New Conventional
Purchase Details
Closed on
Jan 8, 2007
Sold by
Baron Scott D and Baron Lisa M
Bought by
Weiss Thomas J and Weiss Joan M
Home Financials for this Owner
Home Financials are based on the most recent Mortgage that was taken out on this home.
Original Mortgage
$167,000
Interest Rate
6.24%
Mortgage Type
New Conventional
Create a Home Valuation Report for This Property
The Home Valuation Report is an in-depth analysis detailing your home's value as well as a comparison with similar homes in the area
Home Values in the Area
Average Home Value in this Area
Purchase History
| Date | Buyer | Sale Price | Title Company |
|---|---|---|---|
| Poock Jennifer A | $206,500 | -- | |
| Devenport Brian C | $213,000 | None Available | |
| Weiss Thomas J | $225,000 | None Available |
Source: Public Records
Mortgage History
| Date | Status | Borrower | Loan Amount |
|---|---|---|---|
| Previous Owner | Devenport Brian C | $191,700 | |
| Previous Owner | Weiss Thomas J | $167,000 |
Source: Public Records
Tax History Compared to Growth
Tax History
| Year | Tax Paid | Tax Assessment Tax Assessment Total Assessment is a certain percentage of the fair market value that is determined by local assessors to be the total taxable value of land and additions on the property. | Land | Improvement |
|---|---|---|---|---|
| 2024 | $3,640 | $284,300 | $52,900 | $231,400 |
| 2023 | $3,238 | $227,600 | $60,400 | $167,200 |
| 2022 | $3,973 | $227,600 | $60,400 | $167,200 |
| 2021 | $4,074 | $227,600 | $60,400 | $167,200 |
| 2020 | $4,011 | $227,600 | $60,400 | $167,200 |
| 2019 | $3,880 | $227,600 | $60,400 | $167,200 |
| 2018 | $3,767 | $227,600 | $60,400 | $167,200 |
| 2017 | $3,938 | $212,700 | $60,400 | $152,300 |
| 2016 | $3,963 | $212,700 | $60,400 | $152,300 |
| 2015 | $4,043 | $212,700 | $60,400 | $152,300 |
| 2014 | $4,043 | $212,700 | $60,400 | $152,300 |
| 2013 | $4,369 | $212,700 | $60,400 | $152,300 |
Source: Public Records
Map
Nearby Homes
- 1325 Stirling Ct
- 1014 Cottonwood Ct
- 546 S Main St
- 638 Vine St
- 701 Tamarack Dr E
- 1040 Lincoln Dr W
- 915 Schloemer Dr
- 403 S Main St
- 1317 S 7th Ave
- 1403 Carriage Dr
- 636 Westridge Dr Unit B5-3
- 247 S 17th Ave
- 261 S Main St
- 255 S Main St
- 113 S 7th Ave
- 2600 S Main St
- 247 S Main St
- 243 S Main St
- 1707 Eden Dr
- 1444 Hidden Waters Cir
- 839 Highlandview Dr
- 1008 W Decorah Rd
- 829 Highlandview Dr
- 844 Highlandview Dr
- 815 Highlandview Dr
- 832 Highlandview Dr
- 751 Highlandview Dr
- 812 Highlandview Dr
- 745 Highlandview Dr
- 1111 W Decorah Rd
- 1120 W Decorah Rd
- 1111 Evergreen St
- 928 W Decorah Rd
- 1123 Evergreen St
- 1125 W Decorah Rd
- 750 Summit Dr
- 738 Highlandview Dr
- 752 Highlandview Dr
- 727 Highlandview Dr
- 1131 W Decorah Rd