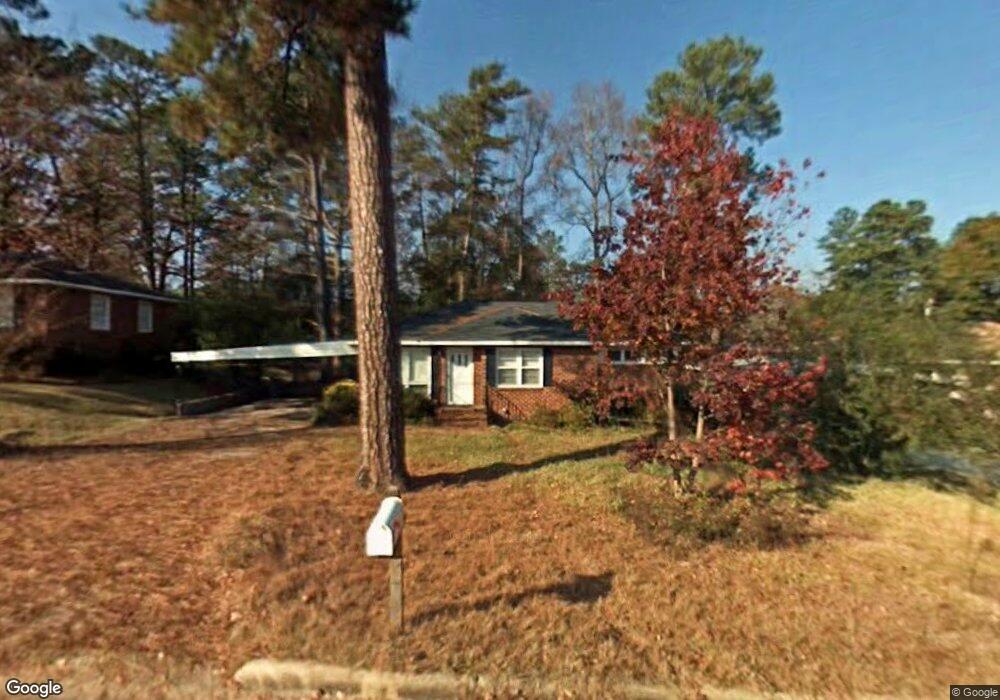
849 Lovick St Columbus, GA 31904
North Columbus NeighborhoodEstimated Value: $138,695 - $173,000
3
Beds
2
Baths
1,480
Sq Ft
$106/Sq Ft
Est. Value
About This Home
This home is located at 849 Lovick St, Columbus, GA 31904 and is currently estimated at $157,424, approximately $106 per square foot. 849 Lovick St is a home located in Muscogee County with nearby schools including River Road Elementary School, Arnold Middle School, and Jordan Vocational High School.
Ownership History
Date
Name
Owned For
Owner Type
Purchase Details
Closed on
Jan 31, 2007
Sold by
Matthews Harry Kent and Matthews Angela Renae
Bought by
Roberts Michael R
Current Estimated Value
Home Financials for this Owner
Home Financials are based on the most recent Mortgage that was taken out on this home.
Original Mortgage
$123,500
Outstanding Balance
$73,889
Interest Rate
6.14%
Mortgage Type
Purchase Money Mortgage
Estimated Equity
$83,535
Create a Home Valuation Report for This Property
The Home Valuation Report is an in-depth analysis detailing your home's value as well as a comparison with similar homes in the area
Home Values in the Area
Average Home Value in this Area
Purchase History
| Date | Buyer | Sale Price | Title Company |
|---|---|---|---|
| Roberts Michael R | $130,000 | None Available |
Source: Public Records
Mortgage History
| Date | Status | Borrower | Loan Amount |
|---|---|---|---|
| Open | Roberts Michael R | $123,500 |
Source: Public Records
Tax History
| Year | Tax Paid | Tax Assessment Tax Assessment Total Assessment is a certain percentage of the fair market value that is determined by local assessors to be the total taxable value of land and additions on the property. | Land | Improvement |
|---|---|---|---|---|
| 2025 | $1,690 | $43,184 | $11,800 | $31,384 |
| 2024 | $1,690 | $43,184 | $11,800 | $31,384 |
| 2023 | $1,701 | $43,184 | $11,800 | $31,384 |
| 2022 | $1,596 | $36,960 | $8,852 | $28,108 |
| 2021 | $1,589 | $37,988 | $8,852 | $29,136 |
| 2020 | $1,590 | $37,988 | $8,852 | $29,136 |
| 2019 | $1,597 | $37,988 | $8,852 | $29,136 |
| 2018 | $1,597 | $37,988 | $8,852 | $29,136 |
| 2017 | $1,604 | $37,988 | $8,852 | $29,136 |
| 2016 | $1,611 | $52,319 | $2,829 | $49,490 |
| 2015 | $1,613 | $52,319 | $2,829 | $49,490 |
| 2014 | $1,616 | $52,319 | $2,829 | $49,490 |
| 2013 | -- | $52,319 | $2,829 | $49,490 |
Source: Public Records
Map
Nearby Homes
Your Personal Tour Guide
Ask me questions while you tour the home.