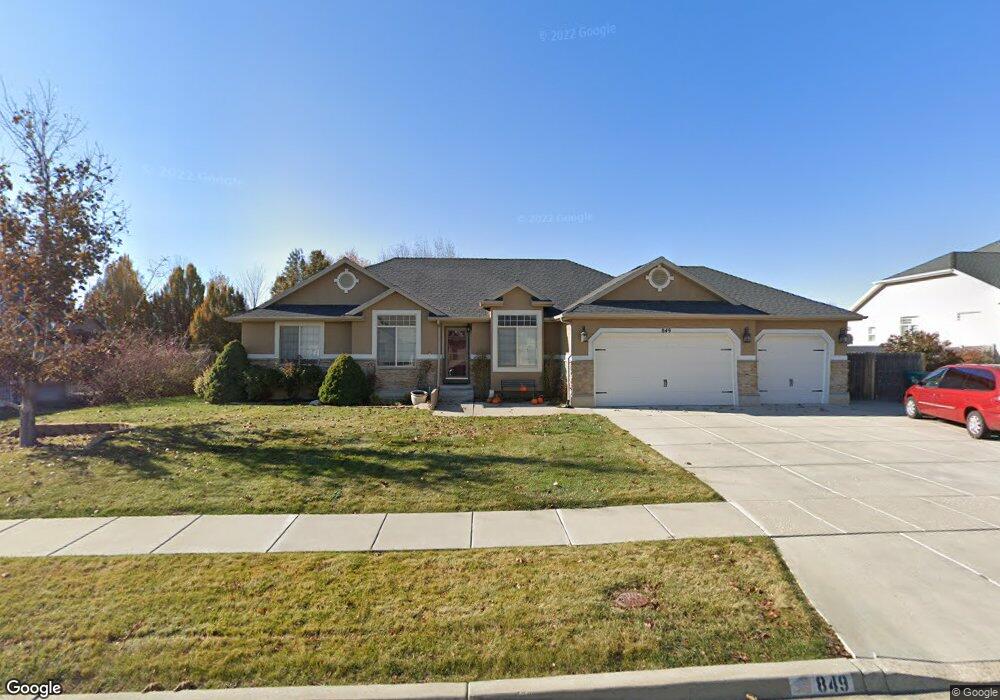
849 N 3625 W Layton, UT 84041
Estimated Value: $690,000 - $713,000
6
Beds
3
Baths
3,438
Sq Ft
$206/Sq Ft
Est. Value
About This Home
This home is located at 849 N 3625 W, Layton, UT 84041 and is currently estimated at $706,885, approximately $205 per square foot. 849 N 3625 W is a home located in Davis County with nearby schools including Sand Springs Elementary School, Legacy Junior High School, and Layton High School.
Ownership History
Date
Name
Owned For
Owner Type
Purchase Details
Closed on
Jan 18, 2012
Sold by
Gabbitas Ladonna
Bought by
Brady Nathan W and Brady Michelle
Current Estimated Value
Home Financials for this Owner
Home Financials are based on the most recent Mortgage that was taken out on this home.
Original Mortgage
$238,789
Outstanding Balance
$166,958
Interest Rate
4.4%
Mortgage Type
FHA
Estimated Equity
$539,927
Purchase Details
Closed on
Jul 8, 2008
Sold by
Gabbitas Gerald K
Bought by
Gabbitas Ladonna and Gabbitas Gerald K
Home Financials for this Owner
Home Financials are based on the most recent Mortgage that was taken out on this home.
Original Mortgage
$257,302
Interest Rate
6.04%
Mortgage Type
New Conventional
Purchase Details
Closed on
Nov 26, 2003
Sold by
Gmw Development Inc
Bought by
Gabbitas Gerald K
Home Financials for this Owner
Home Financials are based on the most recent Mortgage that was taken out on this home.
Original Mortgage
$219,545
Interest Rate
6%
Mortgage Type
Purchase Money Mortgage
Create a Home Valuation Report for This Property
The Home Valuation Report is an in-depth analysis detailing your home's value as well as a comparison with similar homes in the area
Home Values in the Area
Average Home Value in this Area
Purchase History
| Date | Buyer | Sale Price | Title Company |
|---|---|---|---|
| Brady Nathan W | -- | First American Title | |
| Brady Nathan W | -- | First American Title | |
| Gabbitas Ladonna | -- | Empire Land Title Inc | |
| Gabbitas Gerald K | -- | Bonneville Title Company Inc |
Source: Public Records
Mortgage History
| Date | Status | Borrower | Loan Amount |
|---|---|---|---|
| Open | Brady Nathan W | $238,789 | |
| Closed | Brady Nathan W | $238,789 | |
| Previous Owner | Gabbitas Ladonna | $257,302 | |
| Previous Owner | Gabbitas Gerald K | $219,545 |
Source: Public Records
Tax History Compared to Growth
Tax History
| Year | Tax Paid | Tax Assessment Tax Assessment Total Assessment is a certain percentage of the fair market value that is determined by local assessors to be the total taxable value of land and additions on the property. | Land | Improvement |
|---|---|---|---|---|
| 2025 | $3,385 | $355,300 | $147,011 | $208,289 |
| 2024 | $3,428 | $362,450 | $154,246 | $208,204 |
| 2023 | $3,326 | $620,000 | $169,856 | $450,144 |
| 2022 | $3,538 | $358,050 | $94,651 | $263,399 |
| 2021 | $3,120 | $471,000 | $141,922 | $329,078 |
| 2020 | $2,831 | $410,000 | $122,420 | $287,580 |
| 2019 | $2,721 | $386,000 | $118,185 | $267,815 |
| 2018 | $2,521 | $359,000 | $104,461 | $254,539 |
| 2016 | $2,337 | $171,655 | $44,895 | $126,760 |
| 2015 | $2,378 | $165,825 | $44,895 | $120,930 |
| 2014 | $2,054 | $146,455 | $44,895 | $101,560 |
| 2013 | -- | $153,404 | $40,523 | $112,881 |
Source: Public Records
Map
Nearby Homes