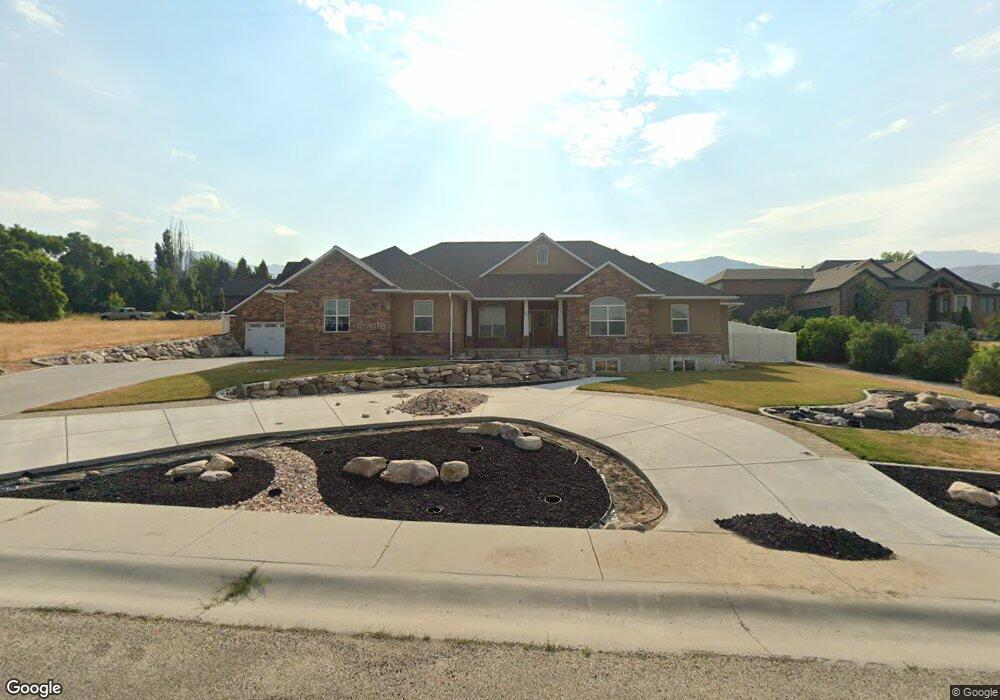
849 S 100 E Richmond, UT 84333
Estimated Value: $627,000 - $799,000
3
Beds
3
Baths
4,432
Sq Ft
$160/Sq Ft
Est. Value
About This Home
This home is located at 849 S 100 E, Richmond, UT 84333 and is currently estimated at $710,955, approximately $160 per square foot. 849 S 100 E is a home located in Cache County with nearby schools including White Pine School, North Cache Middle School, and White Pine Middle School.
Ownership History
Date
Name
Owned For
Owner Type
Purchase Details
Closed on
Aug 12, 2010
Sold by
Flygare Jay and Flygare Linda Mae
Bought by
Gyllenskog James and Gyllenskog Wendy
Current Estimated Value
Home Financials for this Owner
Home Financials are based on the most recent Mortgage that was taken out on this home.
Original Mortgage
$236,000
Outstanding Balance
$155,249
Interest Rate
4.52%
Mortgage Type
Seller Take Back
Estimated Equity
$555,706
Purchase Details
Closed on
Mar 30, 2006
Sold by
Richmond Hills Llc
Bought by
Flygare Jay and Flygare Linda Mae
Create a Home Valuation Report for This Property
The Home Valuation Report is an in-depth analysis detailing your home's value as well as a comparison with similar homes in the area
Home Values in the Area
Average Home Value in this Area
Purchase History
| Date | Buyer | Sale Price | Title Company |
|---|---|---|---|
| Gyllenskog James | -- | Hickman Land Title Company | |
| Flygare Jay | -- | Cache Title Company |
Source: Public Records
Mortgage History
| Date | Status | Borrower | Loan Amount |
|---|---|---|---|
| Open | Gyllenskog James | $236,000 |
Source: Public Records
Tax History
| Year | Tax Paid | Tax Assessment Tax Assessment Total Assessment is a certain percentage of the fair market value that is determined by local assessors to be the total taxable value of land and additions on the property. | Land | Improvement |
|---|---|---|---|---|
| 2025 | $3,193 | $436,020 | $0 | $0 |
| 2024 | $3,523 | $447,370 | $0 | $0 |
| 2023 | $3,563 | $427,515 | $0 | $0 |
| 2022 | $3,704 | $427,515 | $0 | $0 |
| 2021 | $3,629 | $642,087 | $95,000 | $547,087 |
| 2020 | $3,287 | $551,728 | $76,000 | $475,728 |
| 2019 | $3,452 | $551,727 | $76,000 | $475,727 |
| 2018 | $3,012 | $469,357 | $44,600 | $424,757 |
| 2017 | $2,905 | $247,020 | $0 | $0 |
| 2016 | $2,943 | $246,950 | $0 | $0 |
| 2015 | $2,048 | $172,975 | $0 | $0 |
| 2014 | $1,995 | $172,975 | $0 | $0 |
| 2013 | -- | $172,975 | $0 | $0 |
Source: Public Records
Map
Nearby Homes
Your Personal Tour Guide
Ask me questions while you tour the home.