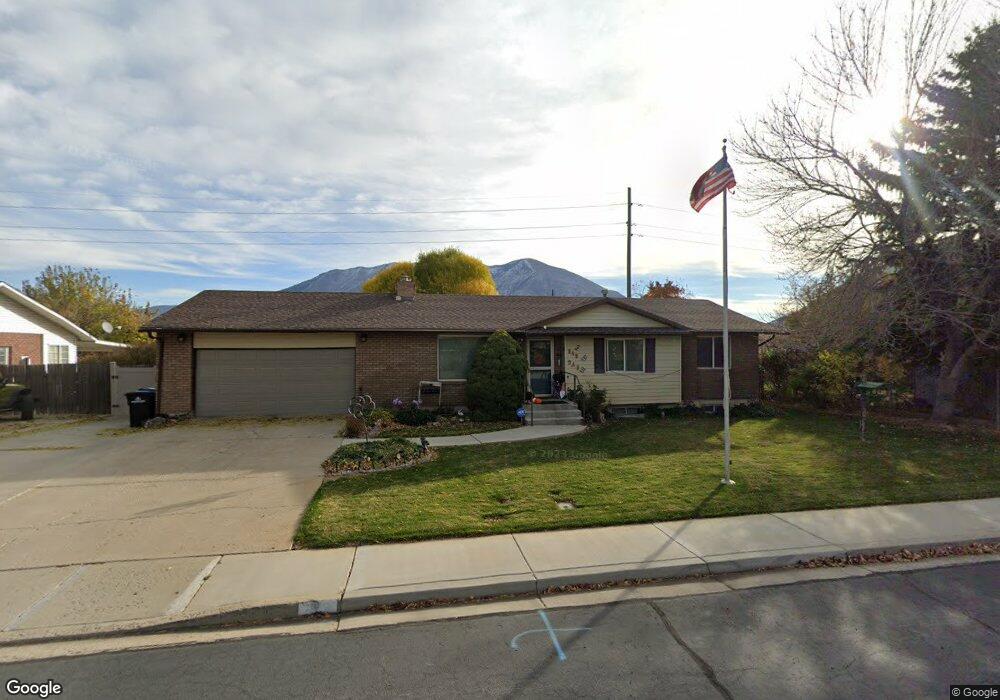
849 S 1240 E Spanish Fork, UT 84660
Estimated Value: $481,000 - $563,000
4
Beds
2
Baths
1,256
Sq Ft
$408/Sq Ft
Est. Value
About This Home
This home is located at 849 S 1240 E, Spanish Fork, UT 84660 and is currently estimated at $512,463, approximately $408 per square foot. 849 S 1240 E is a home located in Utah County with nearby schools including Canyon Elementary School, Spanish Fork Jr High School, and Spanish Fork High School.
Ownership History
Date
Name
Owned For
Owner Type
Purchase Details
Closed on
May 13, 2025
Sold by
Day Darcia
Bought by
Darcia Day Revocable Trust and Day
Current Estimated Value
Home Financials for this Owner
Home Financials are based on the most recent Mortgage that was taken out on this home.
Original Mortgage
$10,000
Outstanding Balance
$9,965
Interest Rate
6.64%
Mortgage Type
Credit Line Revolving
Estimated Equity
$502,498
Purchase Details
Closed on
Aug 5, 2019
Sold by
Day Darcia
Bought by
Day Darcia A and The Darcia Day Revocable Trust
Purchase Details
Closed on
May 24, 2016
Sold by
Day Darcia D
Bought by
Day Darcia
Home Financials for this Owner
Home Financials are based on the most recent Mortgage that was taken out on this home.
Original Mortgage
$142,000
Interest Rate
3.59%
Mortgage Type
New Conventional
Create a Home Valuation Report for This Property
The Home Valuation Report is an in-depth analysis detailing your home's value as well as a comparison with similar homes in the area
Home Values in the Area
Average Home Value in this Area
Purchase History
| Date | Buyer | Sale Price | Title Company |
|---|---|---|---|
| Darcia Day Revocable Trust | -- | Meridian Title | |
| Day Darcia | -- | Meridian Title | |
| Day Darcia A | -- | None Available | |
| Day Darcia | -- | Provo Land Title Co |
Source: Public Records
Mortgage History
| Date | Status | Borrower | Loan Amount |
|---|---|---|---|
| Open | Day Darcia | $10,000 | |
| Previous Owner | Day Darcia | $142,000 |
Source: Public Records
Tax History
| Year | Tax Paid | Tax Assessment Tax Assessment Total Assessment is a certain percentage of the fair market value that is determined by local assessors to be the total taxable value of land and additions on the property. | Land | Improvement |
|---|---|---|---|---|
| 2025 | $2,150 | $242,385 | -- | -- |
| 2024 | $2,170 | $221,595 | $0 | $0 |
| 2023 | $2,188 | $223,960 | $0 | $0 |
| 2022 | $2,188 | $221,430 | $0 | $0 |
| 2021 | $1,841 | $298,100 | $109,200 | $188,900 |
| 2020 | $1,562 | $274,200 | $99,300 | $174,900 |
| 2019 | $1,562 | $258,600 | $85,100 | $173,500 |
| 2018 | $1,430 | $228,900 | $78,000 | $150,900 |
| 2017 | $1,315 | $113,135 | $0 | $0 |
| 2016 | $0 | $103,400 | $0 | $0 |
| 2015 | -- | $101,310 | $0 | $0 |
| 2014 | -- | $99,220 | $0 | $0 |
Source: Public Records
Map
Nearby Homes
- 834 S 1300 #16gc E
- 816 S 1300 E
- 857 S 1300 E Unit 32
- 815 S 1300 E Unit 34
- 762 S 1360 E Unit 25
- 1025 S 3100 E Unit 320
- 2308 E 850 South St Unit 10
- 1692 E 1000 S
- 938 S 1740 E
- 839 S 1760 E
- 2998 Canyon Dr Unit 333
- 3014 Canyon Dr Unit 332
- 320 S 1360 E
- 325 S 1230 E
- 1658 Dover Dr
- 955 E Flonette Ave
- 1878 E 1050 S
- 1166 S 1920 E
- 1238 E 100 S
- 2034 E 800 S
Your Personal Tour Guide
Ask me questions while you tour the home.