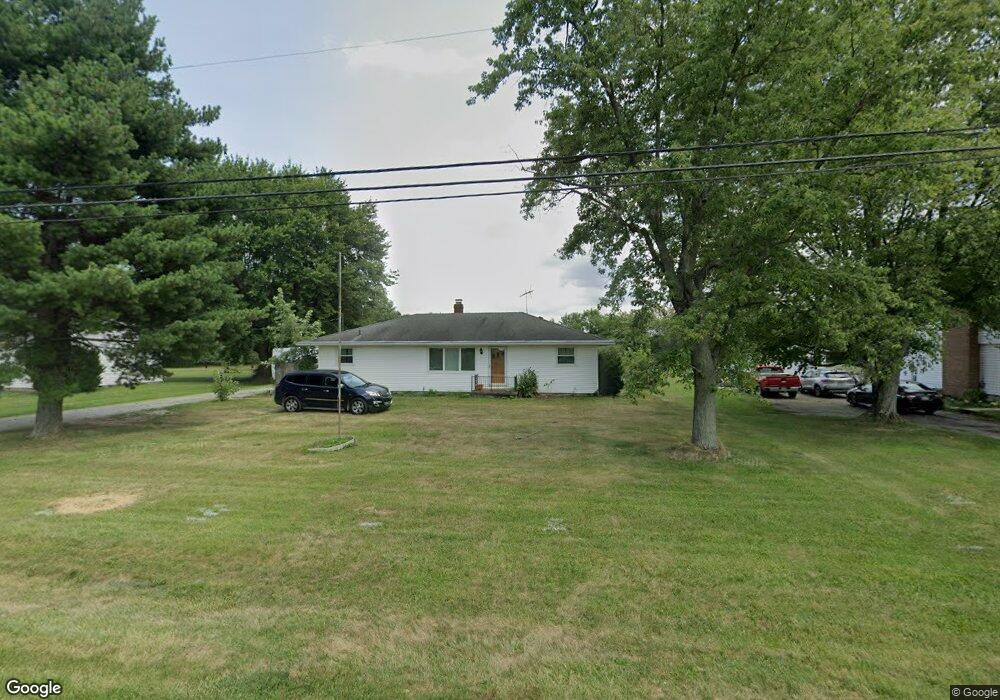
849 S State Route 133 Blanchester, OH 45107
Estimated Value: $200,771 - $253,000
3
Beds
2
Baths
1,140
Sq Ft
$196/Sq Ft
Est. Value
About This Home
This home is located at 849 S State Route 133, Blanchester, OH 45107 and is currently estimated at $223,943, approximately $196 per square foot. 849 S State Route 133 is a home located in Clinton County with nearby schools including Cross Roads Elementary School, Putman Elementary School, and Blanchester Middle School.
Ownership History
Date
Name
Owned For
Owner Type
Purchase Details
Closed on
Apr 26, 2021
Sold by
Herzner Raymond M
Bought by
Herzner Raymond M and Herzner Gerald B
Current Estimated Value
Home Financials for this Owner
Home Financials are based on the most recent Mortgage that was taken out on this home.
Original Mortgage
$106,549
Outstanding Balance
$79,019
Interest Rate
2.38%
Mortgage Type
New Conventional
Estimated Equity
$144,924
Purchase Details
Closed on
Jun 2, 2011
Sold by
Meineke Stephen Robert and Shagena Sharon Meineke
Bought by
Herzner Raymond M
Home Financials for this Owner
Home Financials are based on the most recent Mortgage that was taken out on this home.
Original Mortgage
$71,900
Interest Rate
4.8%
Mortgage Type
Purchase Money Mortgage
Purchase Details
Closed on
Dec 8, 1994
Bought by
Meineke Margaret K Trustee
Create a Home Valuation Report for This Property
The Home Valuation Report is an in-depth analysis detailing your home's value as well as a comparison with similar homes in the area
Home Values in the Area
Average Home Value in this Area
Purchase History
| Date | Buyer | Sale Price | Title Company |
|---|---|---|---|
| Herzner Raymond M | -- | None Listed On Document | |
| Herzner Raymond M | -- | None Listed On Document | |
| Herzner Raymond M | -- | -- | |
| Meineke Margaret K Trustee | -- | -- |
Source: Public Records
Mortgage History
| Date | Status | Borrower | Loan Amount |
|---|---|---|---|
| Open | Herzner Raymond M | $106,549 | |
| Closed | Herzner Raymond M | $106,549 | |
| Previous Owner | Herzner Raymond M | $71,900 |
Source: Public Records
Tax History Compared to Growth
Tax History
| Year | Tax Paid | Tax Assessment Tax Assessment Total Assessment is a certain percentage of the fair market value that is determined by local assessors to be the total taxable value of land and additions on the property. | Land | Improvement |
|---|---|---|---|---|
| 2024 | $2,067 | $53,940 | $9,770 | $44,170 |
| 2023 | $2,067 | $53,940 | $9,770 | $44,170 |
| 2022 | $1,555 | $36,780 | $8,450 | $28,330 |
| 2021 | $1,471 | $33,180 | $8,450 | $24,730 |
| 2020 | $1,433 | $33,180 | $8,450 | $24,730 |
| 2019 | $1,163 | $26,100 | $8,440 | $17,660 |
| 2018 | $1,167 | $26,100 | $8,440 | $17,660 |
| 2017 | $587 | $26,100 | $8,440 | $17,660 |
| 2016 | $1,112 | $25,870 | $8,510 | $17,360 |
| 2015 | $1,112 | $25,870 | $8,510 | $17,360 |
| 2013 | $1,146 | $25,870 | $8,510 | $17,360 |
Source: Public Records
Map
Nearby Homes
- 507 Bourbon St
- 315 Rayford St
- 305 W Main St
- 502 Railroad St
- 128 W Burroughs St
- 753 W Main St
- 301 W Main St
- 107 Central Ave
- 308 S Broadway St
- 0 Ohio 123 Unit 11 938995
- 0 Ohio 123 Unit 1848086
- 503 S Broadway St
- 213 N Broadway St
- 409 N Broadway St
- 401 N Wright St
- 504 Cherry St
- 7484 Fairground Rd
- 7478 Fairground Rd
- 7504 Brock Dr
- 5458 Oak Grove Ave
- 869 S State Route 133
- 869 Ohio 133
- 627 Bourbon St
- 746 St Rt 133
- 624 Bourbon St
- 885 S State Route 133
- 620 Bourbon St
- 619 Bourbon St
- 905 S State Route 133
- 905 Ohio 133
- 45 Leonard Dr
- 925 Ohio 133
- 925 S State Route 133
- 773 Pansy Rd
- 53 Leonard Dr
- 226 Pansy Rd
- 737 Bourbon St
- 69 Leonard Dr
- 746 Bourbon St
- 773 Bourbon St