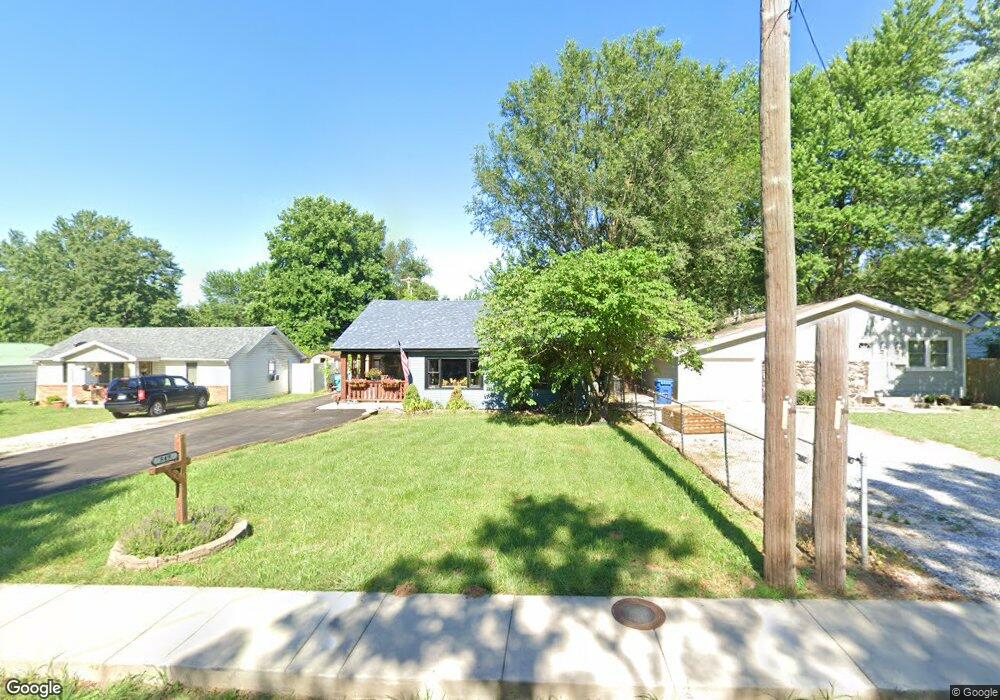
849 S West Ave Springfield, MO 65802
Westside NeighborhoodEstimated Value: $151,000 - $172,000
3
Beds
1
Bath
1,105
Sq Ft
$147/Sq Ft
Est. Value
About This Home
This home is located at 849 S West Ave, Springfield, MO 65802 and is currently estimated at $162,848, approximately $147 per square foot. 849 S West Ave is a home located in Greene County with nearby schools including Central High School and Phelps Center for Gifted Education.
Ownership History
Date
Name
Owned For
Owner Type
Purchase Details
Closed on
Dec 11, 2023
Sold by
Powers Brian E
Bought by
Sorrell Terry R
Current Estimated Value
Purchase Details
Closed on
Dec 18, 2020
Sold by
Municipal Land Company Llc
Bought by
Powers Brian E
Purchase Details
Closed on
Oct 2, 2014
Sold by
Blankenship Burton D and Blankenship Judy
Bought by
Municipal Land Company Llc
Purchase Details
Closed on
Aug 23, 2013
Sold by
Greene County Collector
Bought by
Muncipal Land Co Llc
Create a Home Valuation Report for This Property
The Home Valuation Report is an in-depth analysis detailing your home's value as well as a comparison with similar homes in the area
Home Values in the Area
Average Home Value in this Area
Purchase History
We collect this data history from publicly available records. To have your information removed, we recommend requesting removal directly through your county’s website.
| Date | Buyer | Sale Price | Title Company |
|---|---|---|---|
| Sorrell Terry R | -- | None Listed On Document | |
| Powers Brian E | -- | None Available | |
| Municipal Land Company Llc | -- | -- | |
| Municipal Land Company Llc | -- | -- | |
| Muncipal Land Co Llc | -- | None Available |
Source: Public Records
Tax History
| Year | Tax Paid | Tax Assessment Tax Assessment Total Assessment is a certain percentage of the fair market value that is determined by local assessors to be the total taxable value of land and additions on the property. | Land | Improvement |
|---|---|---|---|---|
| 2025 | $1,162 | $23,330 | $3,800 | $19,530 |
| 2024 | $989 | $18,430 | $2,280 | $16,150 |
| 2023 | $983 | $18,430 | $2,280 | $16,150 |
| 2022 | $415 | $7,600 | $2,280 | $5,320 |
| 2021 | $415 | $7,600 | $2,280 | $5,320 |
| 2020 | $425 | $7,450 | $2,280 | $5,170 |
| 2019 | $413 | $7,450 | $2,280 | $5,170 |
| 2018 | $414 | $7,470 | $1,900 | $5,570 |
| 2017 | $410 | $7,750 | $1,900 | $5,850 |
| 2016 | $425 | $7,750 | $1,900 | $5,850 |
| 2015 | $601 | $7,750 | $1,900 | $5,850 |
| 2014 | $424 | $7,750 | $1,900 | $5,850 |
Source: Public Records
Map
Nearby Homes
- 839 S West Ave
- 2546 W Madison St
- 2552 W Madison St
- 2556 W Madison St
- 2551 W Grand St
- 2316 W Page St
- 2629 W Page St
- 2416 W Monroe St
- 2634 W Madison St
- 2644 W Lombard St
- 2631 W Madison St
- 2540 W State St
- 2544 W State St
- 641 S Warren Ave
- 549 S West Ave
- 2623 W Mount Vernon St
- 2516 W Elm St
- 503 S Forest Ct
- 2936 W Lombard St
- 2938 W Grand St
- 855 S West Ave
- 843 S West Ave
- 861 S West Ave
- 2516 W Page St
- 2515 W Lombard St
- 865 S West Ave
- 2525 W Lombard St
- 850 S West Ave
- 856 S West Ave
- 2526 W Page St
- 2444 W Page St
- 829 S West Ave
- 2517 W Page St
- 2530 W Page St
- 2440 W Page St
- 2427 W Page St
- 2432 W Page St
- 905 S West Ave
- 2525 W Page St
- 822 S West Ave
Your Personal Tour Guide
Ask me questions while you tour the home.