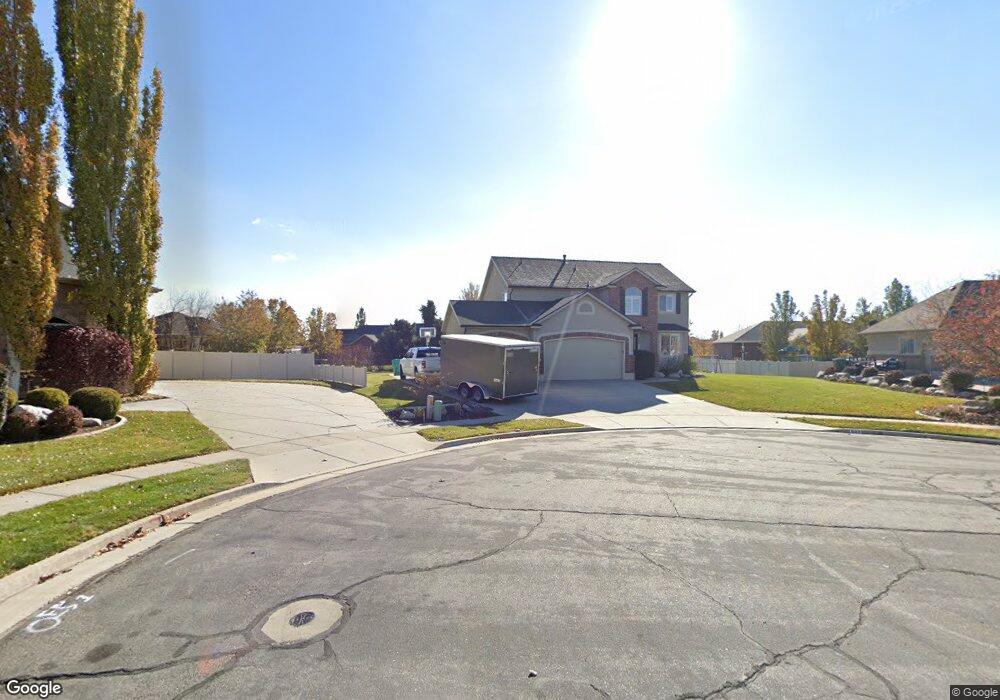
849 W 2985 S Syracuse, UT 84075
Estimated Value: $644,000 - $746,000
4
Beds
3
Baths
2,333
Sq Ft
$301/Sq Ft
Est. Value
About This Home
This home is located at 849 W 2985 S, Syracuse, UT 84075 and is currently estimated at $701,258, approximately $300 per square foot. 849 W 2985 S is a home located in Davis County with nearby schools including Bluff Ridge Elementary, Legacy Junior High School, and Clearfield High School.
Ownership History
Date
Name
Owned For
Owner Type
Purchase Details
Closed on
Feb 25, 2009
Sold by
Taylor Randy L
Bought by
Taylor Randy L and Taylor Melanie M
Current Estimated Value
Purchase Details
Closed on
May 5, 2003
Sold by
Chournos Lance
Bought by
Taylor Randy L
Home Financials for this Owner
Home Financials are based on the most recent Mortgage that was taken out on this home.
Original Mortgage
$212,000
Outstanding Balance
$90,873
Interest Rate
5.72%
Estimated Equity
$610,385
Purchase Details
Closed on
Dec 19, 2002
Sold by
Chournos Lanse
Bought by
Chournos Lanse
Home Financials for this Owner
Home Financials are based on the most recent Mortgage that was taken out on this home.
Original Mortgage
$112,300
Interest Rate
6.03%
Purchase Details
Closed on
Jan 29, 2002
Sold by
Waynell Investment Co Llc
Bought by
Chournos Lance
Create a Home Valuation Report for This Property
The Home Valuation Report is an in-depth analysis detailing your home's value as well as a comparison with similar homes in the area
Home Values in the Area
Average Home Value in this Area
Purchase History
| Date | Buyer | Sale Price | Title Company |
|---|---|---|---|
| Taylor Randy L | -- | Accommodation | |
| Taylor Randy L | -- | Security Title Company | |
| Chournos Lanse | -- | Security Title Company | |
| Chournos Lance | -- | Bonneville Title Company Inc |
Source: Public Records
Mortgage History
| Date | Status | Borrower | Loan Amount |
|---|---|---|---|
| Open | Taylor Randy L | $212,000 | |
| Previous Owner | Chournos Lanse | $112,300 |
Source: Public Records
Tax History
| Year | Tax Paid | Tax Assessment Tax Assessment Total Assessment is a certain percentage of the fair market value that is determined by local assessors to be the total taxable value of land and additions on the property. | Land | Improvement |
|---|---|---|---|---|
| 2025 | $3,289 | $317,350 | $137,976 | $179,374 |
| 2024 | $3,358 | $326,150 | $120,902 | $205,248 |
| 2023 | $3,187 | $564,000 | $168,062 | $395,938 |
| 2022 | $3,333 | $323,400 | $95,791 | $227,609 |
| 2021 | $2,869 | $431,000 | $142,344 | $288,656 |
| 2020 | $2,593 | $377,000 | $120,563 | $256,437 |
| 2019 | $2,515 | $361,000 | $122,058 | $238,942 |
| 2018 | $2,358 | $336,000 | $115,600 | $220,400 |
| 2016 | $2,157 | $161,205 | $44,216 | $116,989 |
| 2015 | $2,199 | $156,475 | $44,216 | $112,259 |
| 2014 | $2,254 | $163,477 | $44,216 | $119,261 |
| 2013 | -- | $151,794 | $40,394 | $111,400 |
Source: Public Records
Map
Nearby Homes
- 921 W 2700 S
- 2766 S 1200 W
- 1282 W 3150 S
- 3475 S Bluff Rd
- 3448 S 550 W
- 1137 W 2500 S
- 3528 S Finch St
- 904 W 2300 S
- 794 W 2300 S
- 1116 W 2325 S
- 1137 2275 S
- 2356 S 1230 W
- 1156 W 2325 S
- 3067 S Old Emigrant Rd Unit B
- 3047 S Old Emigrant Rd
- 1196 W 2325 S
- 2355 S 1230 W
- 2734 S Allison Way Unit 213
- 1295 W 2325 S
- 1315 W 2325 S