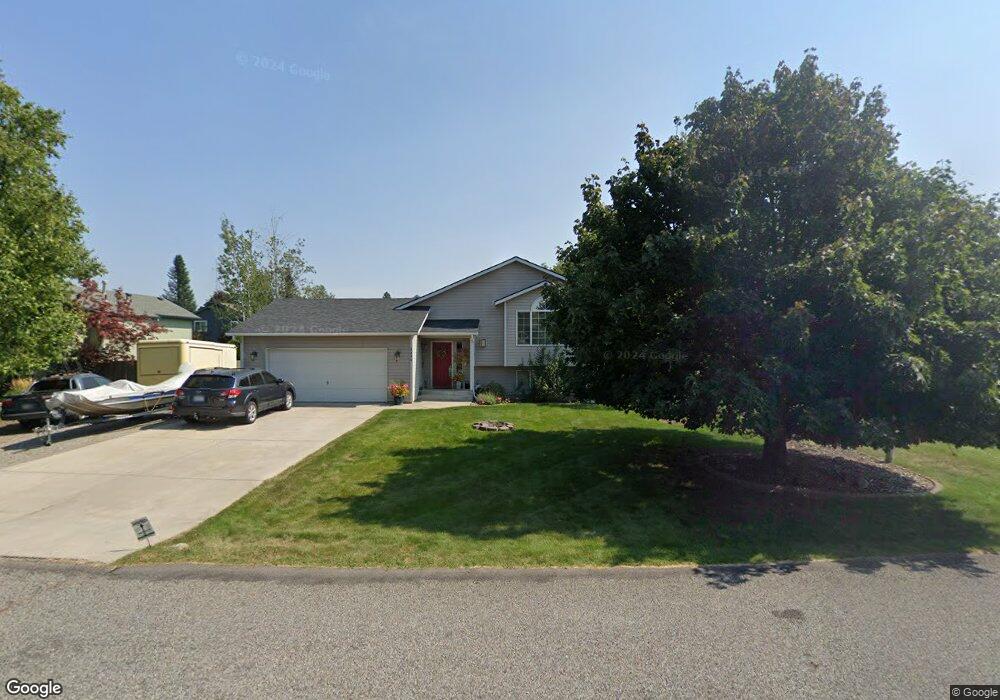
8490 N Cloverleaf Dr Hayden, ID 83835
Estimated Value: $566,000 - $614,000
4
Beds
3
Baths
2,312
Sq Ft
$258/Sq Ft
Est. Value
About This Home
This home is located at 8490 N Cloverleaf Dr, Hayden, ID 83835 and is currently estimated at $595,373, approximately $257 per square foot. 8490 N Cloverleaf Dr is a home located in Kootenai County with nearby schools including Dalton Elementary School, Canfield Middle School, and Coeur d'Alene High School.
Ownership History
Date
Name
Owned For
Owner Type
Purchase Details
Closed on
Jun 21, 2016
Sold by
Murphree Bradey J and Murphree Tiffney B
Bought by
Crupper Ii John L and Crupper Susanna D
Current Estimated Value
Home Financials for this Owner
Home Financials are based on the most recent Mortgage that was taken out on this home.
Original Mortgage
$241,656
Outstanding Balance
$192,331
Interest Rate
3.57%
Mortgage Type
VA
Estimated Equity
$403,042
Purchase Details
Closed on
Oct 3, 2014
Sold by
Whetzel Mitchell
Bought by
Whetzel Jonalyn R
Home Financials for this Owner
Home Financials are based on the most recent Mortgage that was taken out on this home.
Original Mortgage
$206,150
Interest Rate
4.08%
Mortgage Type
New Conventional
Purchase Details
Closed on
Mar 16, 2009
Sold by
Clayton Jonalyn
Bought by
Clayton Jonalyn R
Home Financials for this Owner
Home Financials are based on the most recent Mortgage that was taken out on this home.
Original Mortgage
$95,500
Interest Rate
5.19%
Mortgage Type
New Conventional
Create a Home Valuation Report for This Property
The Home Valuation Report is an in-depth analysis detailing your home's value as well as a comparison with similar homes in the area
Home Values in the Area
Average Home Value in this Area
Purchase History
| Date | Buyer | Sale Price | Title Company |
|---|---|---|---|
| Crupper Ii John L | -- | Alliance Title Coeur D Alene | |
| Whetzel Jonalyn R | -- | First American Title | |
| Murphree Bradey J | -- | First American Title | |
| Clayton Jonalyn R | -- | -- |
Source: Public Records
Mortgage History
| Date | Status | Borrower | Loan Amount |
|---|---|---|---|
| Open | Crupper Ii John L | $241,656 | |
| Previous Owner | Murphree Bradey J | $206,150 | |
| Previous Owner | Clayton Jonalyn R | $95,500 |
Source: Public Records
Tax History Compared to Growth
Tax History
| Year | Tax Paid | Tax Assessment Tax Assessment Total Assessment is a certain percentage of the fair market value that is determined by local assessors to be the total taxable value of land and additions on the property. | Land | Improvement |
|---|---|---|---|---|
| 2025 | $1,808 | $544,981 | $190,000 | $354,981 |
| 2024 | $1,776 | $545,146 | $190,000 | $355,146 |
| 2023 | $1,776 | $533,622 | $195,000 | $338,622 |
| 2022 | $1,980 | $575,198 | $225,000 | $350,198 |
| 2021 | $1,737 | $366,174 | $135,000 | $231,174 |
| 2020 | $1,837 | $325,301 | $126,000 | $199,301 |
| 2019 | $1,637 | $283,400 | $105,000 | $178,400 |
| 2018 | $1,585 | $258,260 | $96,000 | $162,260 |
| 2017 | $1,489 | $238,200 | $79,860 | $158,340 |
| 2016 | $1,201 | $199,960 | $72,600 | $127,360 |
| 2015 | $1,210 | $193,280 | $66,000 | $127,280 |
| 2013 | $1,007 | $158,570 | $46,000 | $112,570 |
Source: Public Records
Map
Nearby Homes
- 8698 N Woodvine Dr
- 8845 N Huntington Ct
- 536 E Cloverleaf Dr
- 494 E Parkside Dr
- 8509 N Sunny Ln
- 8570 N Hayden Pines Way
- 8603 N Hayden Pines Way
- 623 E Maple Place
- 7959 N Valley St
- 9221 N Starr Loop
- 9127 Piper
- 8323 N Tartan Dr
- 9384 N Baack St
- 676 Monashee Ct
- 7671 N 4th St
- 8429 N Snowflake Ln
- 8424 N Snowflake Ln
- 118 E Mid Town Ln
- 9345 N Secretariat Ln
- 9337 N Secretariat Ln
- 8520 N Cloverleaf Dr
- 8520 Cloverleaf Dr
- 8464 Cloverleaf Dr
- 8487 N Rude St
- 8455 N Rude St
- 8527 N Rude St
- 8499 N Cloverleaf Dr
- 8473 N Cloverleaf Dr
- 8473 N Cloverleaf Dr
- 8546 N Cloverleaf Dr
- 8527 N Cloverleaf Dr
- 8424 N Cloverleaf Dr
- 8447 N Cloverleaf Dr
- 8541 N Rude St
- 8570 N Cloverleaf Dr
- 8478 N Rude St
- 8454 N Rude St
- 8568 Cloverleaf
- 8432 N Rude St
- 8504 N Rude St