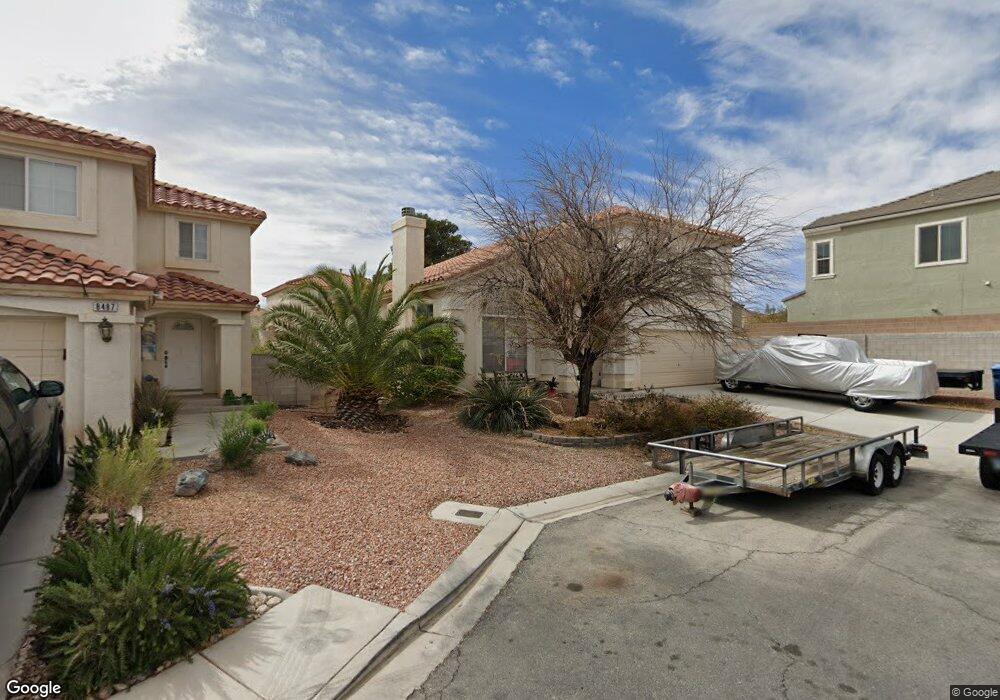
8497 Prince of Tides Ct Las Vegas, NV 89113
Estimated Value: $526,000 - $567,902
4
Beds
3
Baths
2,303
Sq Ft
$236/Sq Ft
Est. Value
About This Home
This home is located at 8497 Prince of Tides Ct, Las Vegas, NV 89113 and is currently estimated at $543,976, approximately $236 per square foot. 8497 Prince of Tides Ct is a home located in Clark County with nearby schools including Lucille S. Rogers Elementary School, Grant Sawyer Middle School, and Durango High School.
Ownership History
Date
Name
Owned For
Owner Type
Purchase Details
Closed on
Nov 7, 2002
Sold by
Adams Keith D and Adams Simonne M
Bought by
Adams Keith D and Adams Simonne M
Current Estimated Value
Home Financials for this Owner
Home Financials are based on the most recent Mortgage that was taken out on this home.
Original Mortgage
$201,663
Outstanding Balance
$84,032
Interest Rate
5.95%
Estimated Equity
$459,944
Purchase Details
Closed on
Jul 30, 2002
Sold by
Adams Keith D
Bought by
Adams Keith D and Adams Simone M
Purchase Details
Closed on
Sep 21, 2001
Sold by
Adams Simoane M
Bought by
Adams Keith D
Purchase Details
Closed on
Oct 28, 1999
Sold by
American West Homes Inc
Bought by
Adams Keith D and Adams Simonne M
Home Financials for this Owner
Home Financials are based on the most recent Mortgage that was taken out on this home.
Original Mortgage
$152,150
Interest Rate
7.96%
Create a Home Valuation Report for This Property
The Home Valuation Report is an in-depth analysis detailing your home's value as well as a comparison with similar homes in the area
Home Values in the Area
Average Home Value in this Area
Purchase History
| Date | Buyer | Sale Price | Title Company |
|---|---|---|---|
| Adams Keith D | -- | Pioneer National Title | |
| Adams Keith D | -- | -- | |
| Adams Keith D | -- | -- | |
| Adams Keith D | $181,400 | First American Title Co |
Source: Public Records
Mortgage History
| Date | Status | Borrower | Loan Amount |
|---|---|---|---|
| Open | Adams Keith D | $201,663 | |
| Previous Owner | Adams Keith D | $152,150 |
Source: Public Records
Tax History Compared to Growth
Tax History
| Year | Tax Paid | Tax Assessment Tax Assessment Total Assessment is a certain percentage of the fair market value that is determined by local assessors to be the total taxable value of land and additions on the property. | Land | Improvement |
|---|---|---|---|---|
| 2025 | $2,135 | $138,454 | $45,500 | $92,954 |
| 2024 | $2,074 | $138,454 | $45,500 | $92,954 |
| 2023 | $2,074 | $128,055 | $40,600 | $87,455 |
| 2022 | $2,013 | $110,050 | $29,750 | $80,300 |
| 2021 | $1,955 | $105,724 | $29,400 | $76,324 |
| 2020 | $1,895 | $102,739 | $26,950 | $75,789 |
| 2019 | $1,840 | $97,726 | $23,100 | $74,626 |
| 2018 | $1,786 | $91,430 | $19,950 | $71,480 |
| 2017 | $2,662 | $90,752 | $18,200 | $72,552 |
| 2016 | $1,772 | $84,937 | $14,000 | $70,937 |
| 2015 | $1,688 | $65,735 | $10,500 | $55,235 |
| 2014 | $1,639 | $54,215 | $7,700 | $46,515 |
Source: Public Records
Map
Nearby Homes
- 5835 Rainbow Trout Ct
- 6128 Stetson Cove Ct
- 8555 W Russell Rd Unit 1078
- 8555 W Russell Rd Unit 1026
- 5766 Whimsical St
- 5762 Whimsical St
- 5758 Whimsical St
- 5754 Whimsical St
- 6168 Stetson Cove Ct
- 5750 Whimsical St
- 5746 Whimsical St
- Kaufman Plan at Tenaya Springs
- Avondale Plan at Tenaya Springs
- Lovell Plan at Tenaya Springs
- 5742 Whimsical St
- Barclay Plan at Majestic Point South
- Bedford Plan at Majestic Point South
- Griffin Plan at Majestic Point South
- 8667 Luxuriant Ave Unit lot 22
- 6256 Haiku Stairs St
- 8487 Prince of Tides Ct
- 8502 Helvetia Ln
- 8503 Helvetia Ln
- 8477 Prince of Tides Ct
- 8508 Helvetia Ln
- 8496 Tackle Box Ct
- 8486 Tackle Box Ct
- 5946 Castell Canyon St
- 8498 Prince of Tides Ct
- 8514 Helvetia Ln
- 8467 Prince of Tides Ct
- 8488 Prince of Tides Ct
- 8501 W Oquendo Rd
- 5952 Castell Canyon St
- 8507 W Oquendo Rd
- 8478 Prince of Tides Ct
- 8466 Tackle Box Ct
- 5958 Castell Canyon St
- 8513 W Oquendo Rd
- 8457 Prince of Tides Ct