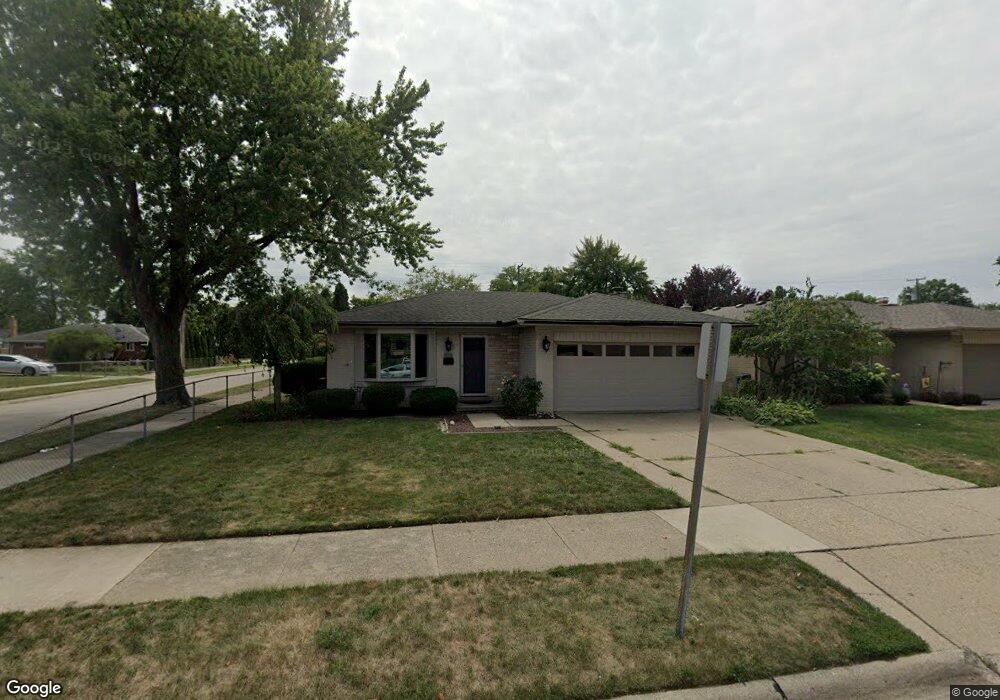
8498 Busch Center Line, MI 48015
Estimated Value: $196,992 - $224,000
3
Beds
2
Baths
1,110
Sq Ft
$189/Sq Ft
Est. Value
About This Home
This home is located at 8498 Busch, Center Line, MI 48015 and is currently estimated at $209,748, approximately $188 per square foot. 8498 Busch is a home located in Macomb County with nearby schools including May V. Peck Elementary School, Center Line High School, and Wolfe Middle School.
Ownership History
Date
Name
Owned For
Owner Type
Purchase Details
Closed on
Feb 5, 2021
Sold by
Tiensivu Michael D
Bought by
Tiensivu Michael D and Tiensivu Connie
Current Estimated Value
Home Financials for this Owner
Home Financials are based on the most recent Mortgage that was taken out on this home.
Original Mortgage
$120,000
Outstanding Balance
$88,155
Interest Rate
2.6%
Mortgage Type
New Conventional
Estimated Equity
$121,593
Purchase Details
Closed on
Nov 22, 2004
Sold by
Tiensivu Michael D and Tiensivu Cari A
Bought by
Tiensivu Michael D
Home Financials for this Owner
Home Financials are based on the most recent Mortgage that was taken out on this home.
Original Mortgage
$132,200
Interest Rate
5.8%
Mortgage Type
Stand Alone Refi Refinance Of Original Loan
Purchase Details
Closed on
Aug 22, 1996
Sold by
Garrett R and Garrett D
Bought by
Tiensivu M and Tiensivu C
Create a Home Valuation Report for This Property
The Home Valuation Report is an in-depth analysis detailing your home's value as well as a comparison with similar homes in the area
Home Values in the Area
Average Home Value in this Area
Purchase History
| Date | Buyer | Sale Price | Title Company |
|---|---|---|---|
| Tiensivu Michael D | -- | None Available | |
| Tiensivu Michael D | -- | Stewart Title | |
| Tiensivu M | $110,500 | -- |
Source: Public Records
Mortgage History
| Date | Status | Borrower | Loan Amount |
|---|---|---|---|
| Open | Tiensivu Michael D | $120,000 | |
| Closed | Tiensivu Michael D | $132,200 |
Source: Public Records
Tax History Compared to Growth
Tax History
| Year | Tax Paid | Tax Assessment Tax Assessment Total Assessment is a certain percentage of the fair market value that is determined by local assessors to be the total taxable value of land and additions on the property. | Land | Improvement |
|---|---|---|---|---|
| 2025 | $2,542 | $88,100 | $0 | $0 |
| 2024 | $2,007 | $81,900 | $0 | $0 |
| 2023 | $1,937 | $73,700 | $0 | $0 |
| 2022 | $2,400 | $64,700 | $0 | $0 |
| 2021 | $2,498 | $59,700 | $0 | $0 |
| 2020 | $2,038 | $55,200 | $0 | $0 |
| 2019 | $2,791 | $49,000 | $0 | $0 |
| 2018 | $0 | $41,260 | $0 | $0 |
| 2017 | $2,589 | $37,590 | $6,610 | $30,980 |
| 2016 | $2,384 | $37,590 | $0 | $0 |
| 2015 | -- | $34,150 | $0 | $0 |
| 2011 | -- | $42,560 | $5,170 | $37,390 |
Source: Public Records
Map
Nearby Homes