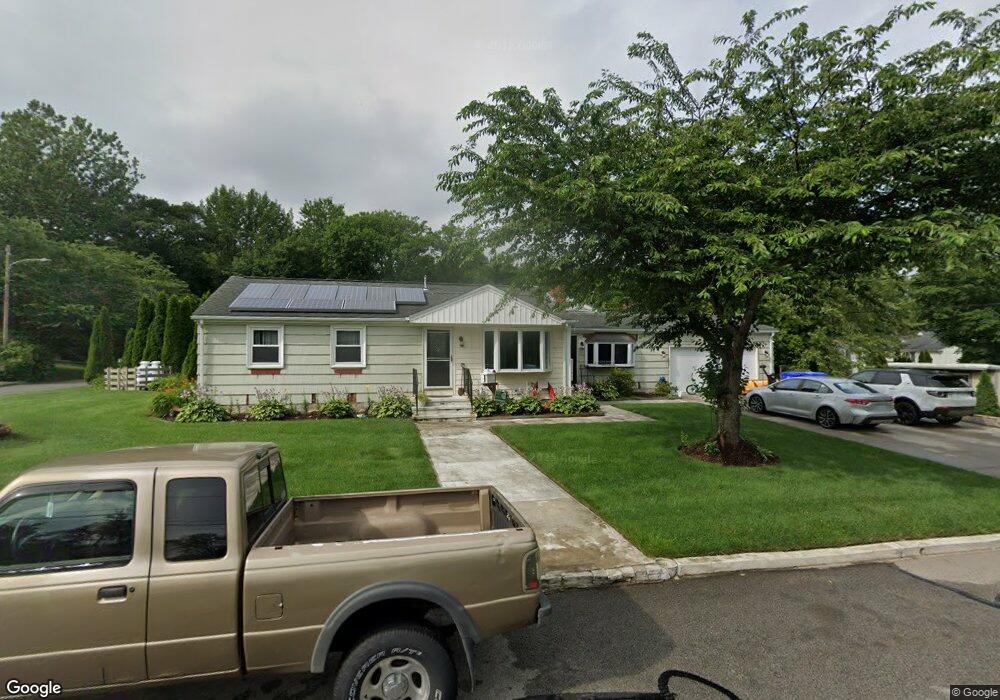
85 Alden Dr West Warwick, RI 02893
Natick NeighborhoodEstimated Value: $388,000 - $463,574
3
Beds
1
Bath
1,120
Sq Ft
$378/Sq Ft
Est. Value
About This Home
This home is located at 85 Alden Dr, West Warwick, RI 02893 and is currently estimated at $423,394, approximately $378 per square foot. 85 Alden Dr is a home located in Kent County with nearby schools including West Warwick High School, St Joseph School, and Islamic School of Rhode Island.
Ownership History
Date
Name
Owned For
Owner Type
Purchase Details
Closed on
Oct 18, 2021
Sold by
Agosto Xavier
Bought by
Agosto-Falcon Xavier
Current Estimated Value
Home Financials for this Owner
Home Financials are based on the most recent Mortgage that was taken out on this home.
Original Mortgage
$200,000
Outstanding Balance
$181,588
Interest Rate
2.8%
Mortgage Type
Stand Alone Refi Refinance Of Original Loan
Estimated Equity
$241,806
Purchase Details
Closed on
Sep 23, 2010
Sold by
Pawtucket Cu
Bought by
Agosto Xavier
Home Financials for this Owner
Home Financials are based on the most recent Mortgage that was taken out on this home.
Original Mortgage
$168,000
Interest Rate
4.48%
Mortgage Type
Purchase Money Mortgage
Purchase Details
Closed on
Jan 22, 2009
Sold by
Oliver John F and Pawtucket Cu
Bought by
Pawtucket Cu
Create a Home Valuation Report for This Property
The Home Valuation Report is an in-depth analysis detailing your home's value as well as a comparison with similar homes in the area
Home Values in the Area
Average Home Value in this Area
Purchase History
| Date | Buyer | Sale Price | Title Company |
|---|---|---|---|
| Agosto-Falcon Xavier | -- | None Available | |
| Agosto-Falcon Xavier | -- | None Available | |
| Agosto Xavier | $173,000 | -- | |
| Pawtucket Cu | $185,000 | -- |
Source: Public Records
Mortgage History
| Date | Status | Borrower | Loan Amount |
|---|---|---|---|
| Open | Agosto-Falcon Xavier | $200,000 | |
| Closed | Agosto-Falcon Xavier | $200,000 | |
| Previous Owner | Pawtucket Cu | $168,000 | |
| Previous Owner | Pawtucket Cu | $185,000 | |
| Previous Owner | Pawtucket Cu | $40,000 |
Source: Public Records
Tax History Compared to Growth
Tax History
| Year | Tax Paid | Tax Assessment Tax Assessment Total Assessment is a certain percentage of the fair market value that is determined by local assessors to be the total taxable value of land and additions on the property. | Land | Improvement |
|---|---|---|---|---|
| 2025 | $5,766 | $403,500 | $120,600 | $282,900 |
| 2024 | $5,444 | $291,300 | $89,900 | $201,400 |
| 2023 | $5,337 | $291,300 | $89,900 | $201,400 |
| 2022 | $4,873 | $270,100 | $89,900 | $180,200 |
| 2021 | $4,609 | $200,400 | $67,400 | $133,000 |
| 2020 | $4,609 | $200,400 | $67,400 | $133,000 |
| 2019 | $5,876 | $200,400 | $67,400 | $133,000 |
| 2018 | $4,344 | $164,500 | $71,300 | $93,200 |
| 2017 | $4,328 | $164,500 | $71,300 | $93,200 |
| 2016 | $4,251 | $164,500 | $71,300 | $93,200 |
| 2015 | $4,060 | $156,400 | $71,300 | $85,100 |
| 2014 | $3,971 | $156,400 | $71,300 | $85,100 |
Source: Public Records
Map
Nearby Homes
- 71 Steven Dr
- 0 Natick Rd
- 61 Crossland Rd
- 11 Chaple Dr
- 37 Carriage Rd
- 63 Governors Hill Unit 63
- 25 Wilson St
- 54 River St Unit 4
- 132 Prospect Hill Ave
- 8 Lily Ln Unit 8
- 780 Providence St
- 99 Walden Way
- 3 Apple Blossom Way
- 744 Providence St
- 51 Gilcrest Dr
- 15 Carrie Ann Dr
- 81 W Pontiac St
- 74 Pontiac St
- 1 Penta St
- 202 River Farms Dr