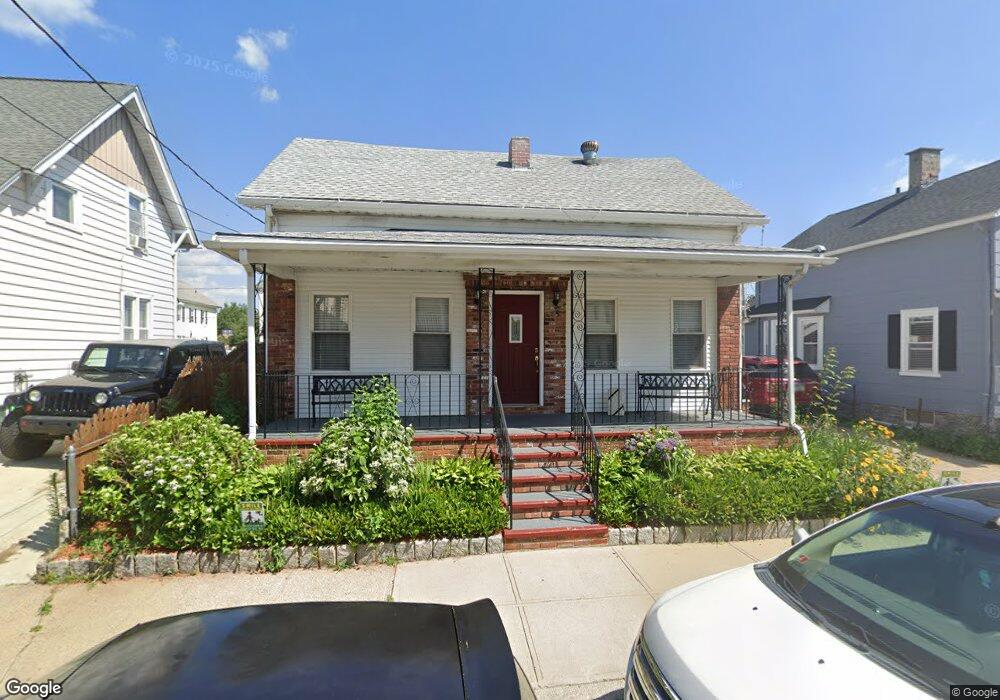
85 Carpenter St Pawtucket, RI 02860
Downtown Pawtucket NeighborhoodEstimated Value: $277,000 - $385,078
3
Beds
3
Baths
1,717
Sq Ft
$200/Sq Ft
Est. Value
About This Home
This home is located at 85 Carpenter St, Pawtucket, RI 02860 and is currently estimated at $343,270, approximately $199 per square foot. 85 Carpenter St is a home located in Providence County with nearby schools including Blackstone Valley Prep Junior High School.
Ownership History
Date
Name
Owned For
Owner Type
Purchase Details
Closed on
Jun 17, 2024
Sold by
Depina Elisa C
Bought by
Hill Olga
Current Estimated Value
Purchase Details
Closed on
Dec 3, 1992
Sold by
Grayko David R
Bought by
Silveira Jose S and Silveira Madelena
Create a Home Valuation Report for This Property
The Home Valuation Report is an in-depth analysis detailing your home's value as well as a comparison with similar homes in the area
Home Values in the Area
Average Home Value in this Area
Purchase History
| Date | Buyer | Sale Price | Title Company |
|---|---|---|---|
| Hill Olga | -- | None Available | |
| Hill Olga | -- | None Available | |
| Silveira Jose S | $59,000 | -- |
Source: Public Records
Mortgage History
| Date | Status | Borrower | Loan Amount |
|---|---|---|---|
| Previous Owner | Silveira Jose S | $232,933 | |
| Previous Owner | Silveira Jose S | $229,491 | |
| Previous Owner | Silveira Jose S | $223,250 | |
| Previous Owner | Silveira Jose S | $144,850 |
Source: Public Records
Tax History
| Year | Tax Paid | Tax Assessment Tax Assessment Total Assessment is a certain percentage of the fair market value that is determined by local assessors to be the total taxable value of land and additions on the property. | Land | Improvement |
|---|---|---|---|---|
| 2025 | $3,838 | $291,900 | $105,100 | $186,800 |
| 2024 | $3,602 | $291,900 | $105,100 | $186,800 |
| 2023 | $3,413 | $201,500 | $47,300 | $154,200 |
| 2022 | $3,341 | $201,500 | $47,300 | $154,200 |
| 2021 | $3,341 | $201,500 | $47,300 | $154,200 |
| 2020 | $3,359 | $160,800 | $47,900 | $112,900 |
| 2019 | $3,359 | $160,800 | $47,900 | $112,900 |
| 2018 | $3,237 | $160,800 | $47,900 | $112,900 |
| 2017 | $3,058 | $134,600 | $38,000 | $96,600 |
| 2016 | $2,946 | $134,600 | $38,000 | $96,600 |
| 2015 | $2,946 | $134,600 | $38,000 | $96,600 |
| 2014 | $3,079 | $133,500 | $48,900 | $84,600 |
Source: Public Records
Map
Nearby Homes
- 27 Lloyd St
- 17 Beecher St
- 75 Larch St
- 48 Star St
- 14 Martin Ct
- 75 Baldwin St
- 546 Lonsdale Ave Unit 548
- 193 Harrison St
- 76 Slater St
- 616 Lonsdale Ave Unit 618
- 35 Hurley Ave
- 59 West Ave
- 584 Weeden St
- 57 Garden St
- 107 Mulberry St
- 140 Dexter St
- 45 Harrison St
- 0 Webb St Unit 1406927
- 0 Webb St Unit 73489835
- 28 Bayley St Unit 107
- 48 Sumner St
- 89 Carpenter St
- 79 Carpenter St
- 95 Carpenter St
- 0 Sumner St
- 73 Carpenter St
- 84 Carpenter St
- 88 Carpenter St
- 78 Carpenter St
- 94 Carpenter St
- 67 Carpenter St
- 72 Carpenter St
- 99 Carpenter St
- 30 Sumner St
- 41 Sumner St
- 45 Sumner St
- 57 Sumner St
- 102 Carpenter St
- 53 Sumner St
- 53 Sumner St Unit 2
Your Personal Tour Guide
Ask me questions while you tour the home.