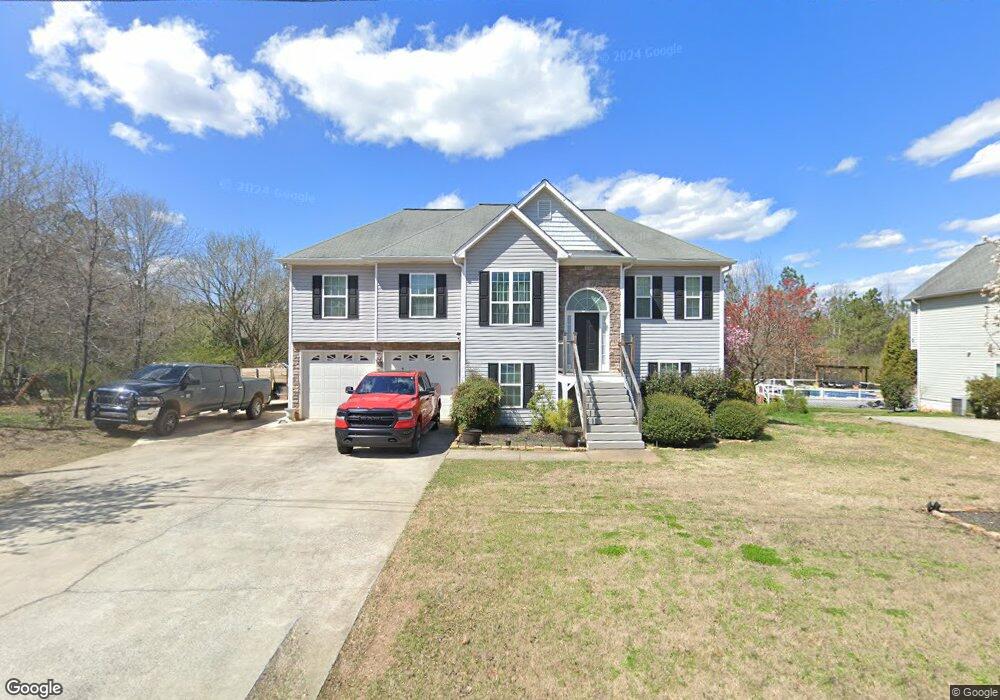
85 Cedar Creek Crossing Cedartown, GA 30125
Estimated Value: $286,000 - $324,000
3
Beds
2
Baths
1,591
Sq Ft
$190/Sq Ft
Est. Value
About This Home
This home is located at 85 Cedar Creek Crossing, Cedartown, GA 30125 and is currently estimated at $302,709, approximately $190 per square foot. 85 Cedar Creek Crossing is a home located in Polk County with nearby schools including Vineyard Harvester Christian Academy and Cedar Christian School.
Ownership History
Date
Name
Owned For
Owner Type
Purchase Details
Closed on
Feb 20, 2009
Sold by
Fannie Mae(Aka Federal National Mortgage
Bought by
Bankston Dana M
Current Estimated Value
Home Financials for this Owner
Home Financials are based on the most recent Mortgage that was taken out on this home.
Original Mortgage
$126,400
Outstanding Balance
$80,114
Interest Rate
5.15%
Mortgage Type
New Conventional
Estimated Equity
$222,595
Purchase Details
Closed on
Dec 2, 2008
Sold by
Wells Fargo Bank
Bought by
Federal National Mtg Associati
Purchase Details
Closed on
Nov 13, 2007
Sold by
Brooks Wren Homes Inc
Bought by
Jones Jeremy and Jones Georgina
Purchase Details
Closed on
Oct 14, 2005
Sold by
Hitchcock D L
Bought by
Brooks Wren Homes Inc
Create a Home Valuation Report for This Property
The Home Valuation Report is an in-depth analysis detailing your home's value as well as a comparison with similar homes in the area
Home Values in the Area
Average Home Value in this Area
Purchase History
| Date | Buyer | Sale Price | Title Company |
|---|---|---|---|
| Bankston Dana M | $126,400 | -- | |
| Federal National Mtg Associati | -- | -- | |
| Wells Fargo Bank | -- | -- | |
| Jones Jeremy | $137,500 | -- | |
| Brooks Wren Homes Inc | $150,000 | -- |
Source: Public Records
Mortgage History
| Date | Status | Borrower | Loan Amount |
|---|---|---|---|
| Open | Bankston Dana M | $126,400 |
Source: Public Records
Tax History Compared to Growth
Tax History
| Year | Tax Paid | Tax Assessment Tax Assessment Total Assessment is a certain percentage of the fair market value that is determined by local assessors to be the total taxable value of land and additions on the property. | Land | Improvement |
|---|---|---|---|---|
| 2024 | $2,545 | $123,752 | $12,000 | $111,752 |
| 2023 | $2,012 | $86,760 | $12,000 | $74,760 |
| 2022 | $1,745 | $73,546 | $8,000 | $65,546 |
| 2021 | $1,768 | $73,546 | $8,000 | $65,546 |
| 2020 | $1,772 | $73,546 | $8,000 | $65,546 |
| 2019 | $1,801 | $67,076 | $10,000 | $57,076 |
| 2018 | $1,739 | $63,124 | $10,000 | $53,124 |
| 2017 | $1,718 | $63,124 | $10,000 | $53,124 |
| 2016 | $1,718 | $63,124 | $10,000 | $53,124 |
| 2015 | $1,723 | $63,124 | $10,000 | $53,124 |
| 2014 | $1,736 | $63,124 | $10,000 | $53,124 |
Source: Public Records
Map
Nearby Homes
- 383 Valley Grove Rd
- 424 Michael Blvd
- 100 Lee Ave
- 374 Seab Green Rd
- 0 Cave Spring Rd Unit 10631588
- 0 Cave Spring Rd Unit 7671027
- 1200 N Cave Spring St
- 600 Miller Rd
- 39 Summerwind Dr
- 208 Silverthorn Way
- 727 Cherokee Rd
- 217 Cherokee Cir
- LOT 21 Cherokee Cir
- 828 N College Dr
- 621 N College Dr
- 00 Oak Crest Dr
- 88 Sequoyah Ct
- 521 W John Hand Rd
- 112 College Cir
- 113 Cherokee Estates Dr
- 71 Cedar Creek Crossing
- 88 Cedar Creek Crossing
- 107 Cedar Creek Crossing
- 112 Cedar Creek Crossing
- 70 Cedar Creek Crossing
- 70 Cedar Creek Crossing Unit 24
- 133 Cedar Creek Crossing
- 132 Cedar Creek Crossing
- 49 Cedar Creek Crossing
- 142 Cedar Creek Crossing
- 153 Cedar Creek Crossing Unit 11&12
- 153 Cedar Creek Crossing
- 152 Cedar Creek Crossing
- 163 Cedar Creek Crossing
- 1867 Cave Springs Rd
- 56 Cedar Creek Crossing
- 172 Cedar Creek Crossing
- 173 Cedar Creek Crossing
- 9 Cedar Creek Crossing
- 1942 N Cave Spring St