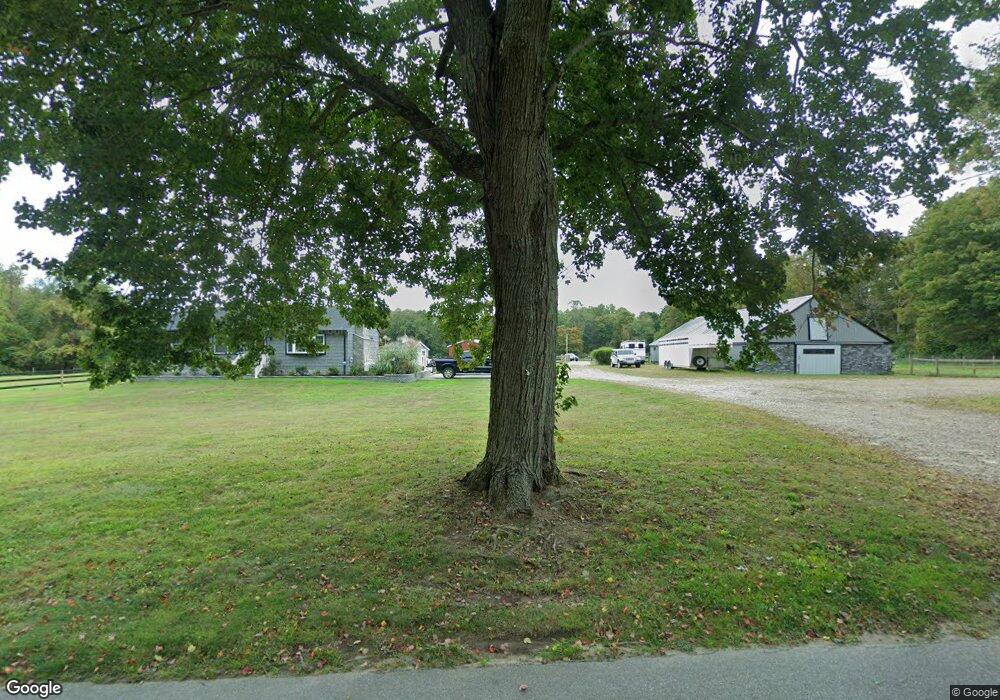
85 Clark Rd Colchester, CT 06415
Estimated Value: $482,000 - $645,000
3
Beds
2
Baths
1,716
Sq Ft
$336/Sq Ft
Est. Value
About This Home
This home is located at 85 Clark Rd, Colchester, CT 06415 and is currently estimated at $576,696, approximately $336 per square foot. 85 Clark Rd is a home located in New London County with nearby schools including Colchester Elementary School, Jack Jackter Intermediate School, and William J. Johnston Middle School.
Ownership History
Date
Name
Owned For
Owner Type
Purchase Details
Closed on
Oct 23, 2001
Sold by
Gooding Roy and Gooding Teena
Bought by
Denne Graham and Seidel Linda
Current Estimated Value
Home Financials for this Owner
Home Financials are based on the most recent Mortgage that was taken out on this home.
Original Mortgage
$210,000
Outstanding Balance
$78,351
Interest Rate
6.25%
Estimated Equity
$498,345
Create a Home Valuation Report for This Property
The Home Valuation Report is an in-depth analysis detailing your home's value as well as a comparison with similar homes in the area
Home Values in the Area
Average Home Value in this Area
Purchase History
| Date | Buyer | Sale Price | Title Company |
|---|---|---|---|
| Denne Graham | $337,500 | -- |
Source: Public Records
Mortgage History
| Date | Status | Borrower | Loan Amount |
|---|---|---|---|
| Open | Denne Graham | $210,000 | |
| Previous Owner | Denne Graham | $115,000 | |
| Previous Owner | Denne Graham | $20,000 |
Source: Public Records
Tax History
| Year | Tax Paid | Tax Assessment Tax Assessment Total Assessment is a certain percentage of the fair market value that is determined by local assessors to be the total taxable value of land and additions on the property. | Land | Improvement |
|---|---|---|---|---|
| 2025 | $9,527 | $318,400 | $60,200 | $258,200 |
| 2024 | $8,928 | $311,400 | $60,200 | $251,200 |
| 2023 | $8,476 | $311,400 | $60,200 | $251,200 |
| 2022 | $8,362 | $308,800 | $60,200 | $248,600 |
| 2021 | $8,236 | $250,800 | $60,200 | $190,600 |
| 2020 | $7,891 | $240,300 | $60,200 | $180,100 |
| 2019 | $7,891 | $240,300 | $60,200 | $180,100 |
| 2018 | $7,563 | $234,300 | $60,200 | $174,100 |
| 2017 | $7,251 | $224,000 | $60,200 | $163,800 |
| 2016 | $5,715 | $184,900 | $72,300 | $112,600 |
| 2015 | $5,688 | $184,900 | $72,300 | $112,600 |
| 2014 | $5,652 | $184,900 | $72,300 | $112,600 |
Source: Public Records
Map
Nearby Homes
Your Personal Tour Guide
Ask me questions while you tour the home.