Estimated Value: $495,121 - $578,000
Studio
--
Bath
1,987
Sq Ft
$273/Sq Ft
Est. Value
About This Home
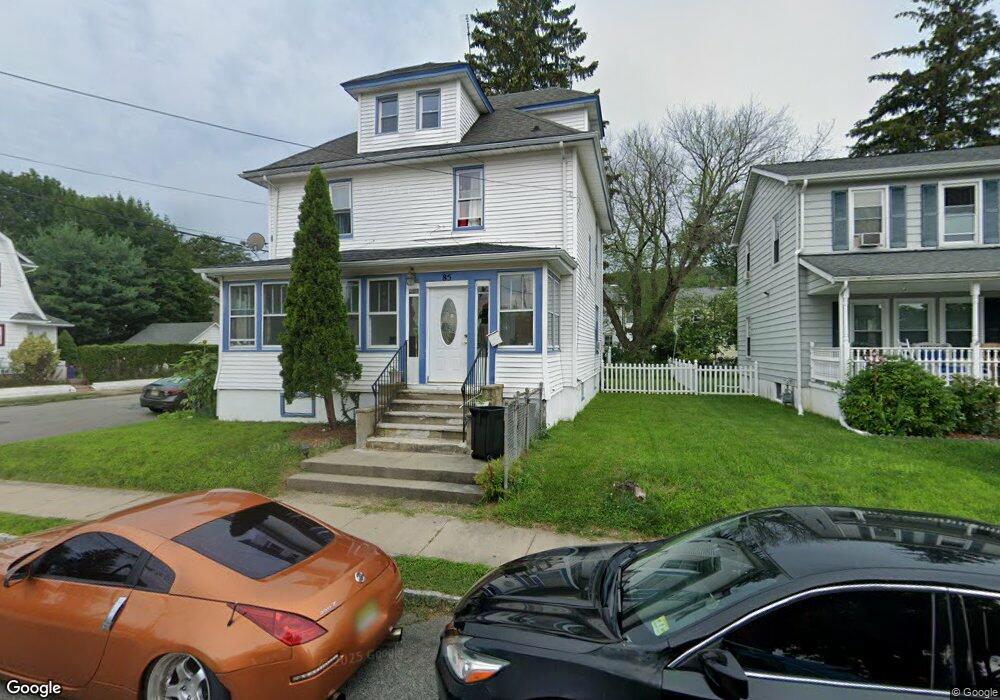
This home is located at 85 Clark St, Dover, NJ 07801 and is currently estimated at $542,280, approximately $272 per square foot. 85 Clark St is a home located in Morris County with nearby schools including Dover Middle School and Dover High School.
Ownership History
Date
Name
Owned For
Owner Type
Purchase Details
Closed on
Mar 9, 2004
Sold by
Marin Jose
Bought by
Buri Segundo
Current Estimated Value
Home Financials for this Owner
Home Financials are based on the most recent Mortgage that was taken out on this home.
Original Mortgage
$276,000
Outstanding Balance
$129,352
Interest Rate
5.71%
Estimated Equity
$412,928
Purchase Details
Closed on
Sep 30, 1999
Sold by
Segura Lilia A
Bought by
Navarete Gonzalo A and Marin Jose Luis
Home Financials for this Owner
Home Financials are based on the most recent Mortgage that was taken out on this home.
Original Mortgage
$209,101
Interest Rate
7.81%
Mortgage Type
FHA
Purchase Details
Closed on
Mar 11, 1997
Sold by
Sampen Agustin and Segura Lilia A
Bought by
Segura Lilia A
Purchase Details
Closed on
Aug 15, 1996
Sold by
Carlsen Oda
Bought by
Sampen Agustin and Segura Lilia A
Home Financials for this Owner
Home Financials are based on the most recent Mortgage that was taken out on this home.
Original Mortgage
$135,992
Interest Rate
8.4%
Mortgage Type
FHA
Create a Home Valuation Report for This Property
The Home Valuation Report is an in-depth analysis detailing your home's value as well as a comparison with similar homes in the area
Home Values in the Area
Average Home Value in this Area
Purchase History
| Date | Buyer | Sale Price | Title Company |
|---|---|---|---|
| Buri Segundo | $345,000 | -- | |
| Navarete Gonzalo A | $200,900 | Chicago Title Insurance Co | |
| Segura Lilia A | -- | -- | |
| Sampen Agustin | $147,000 | -- |
Source: Public Records
Mortgage History
| Date | Status | Borrower | Loan Amount |
|---|---|---|---|
| Open | Buri Segundo | $276,000 | |
| Previous Owner | Navarete Gonzalo A | $209,101 | |
| Previous Owner | Sampen Agustin | $135,992 |
Source: Public Records
Tax History
| Year | Tax Paid | Tax Assessment Tax Assessment Total Assessment is a certain percentage of the fair market value that is determined by local assessors to be the total taxable value of land and additions on the property. | Land | Improvement |
|---|---|---|---|---|
| 2025 | $8,359 | $255,400 | $86,200 | $169,200 |
| 2024 | $8,063 | $255,400 | $86,200 | $169,200 |
| 2023 | $8,063 | $255,400 | $86,200 | $169,200 |
| 2022 | $7,414 | $255,400 | $86,200 | $169,200 |
| 2021 | $7,414 | $255,400 | $86,200 | $169,200 |
| 2020 | $7,266 | $255,400 | $86,200 | $169,200 |
| 2019 | $6,965 | $255,400 | $86,200 | $169,200 |
| 2018 | $6,582 | $255,400 | $86,200 | $169,200 |
| 2017 | $6,283 | $255,400 | $86,200 | $169,200 |
| 2016 | $6,135 | $255,400 | $86,200 | $169,200 |
| 2015 | $6,235 | $303,400 | $120,000 | $183,400 |
| 2014 | $6,171 | $303,400 | $120,000 | $183,400 |
Source: Public Records
Map
Nearby Homes
- 4 W Cooper St
- 301 E McFarlan St -A and B
- 12 David St
- 12 Lincoln Ave
- 179 Pequannock St
- 515 Herrick Dr
- 14 Jessica Ln
- 121 W Clinton St
- 13 James St
- 19 Heritage Way
- 22 Faesch Ct
- 31 Independence Way
- 75 White St
- 5 A&B Dewey St
- 142 W Blackwell St
- 77B Highland Way
- 67 Victory Ct Unit 67B
- 71 Washington Ave Unit 73
- 34 Hillsborough Ct Unit 34
- 414 Mineral Springs Dr
Your Personal Tour Guide
Ask me questions while you tour the home.