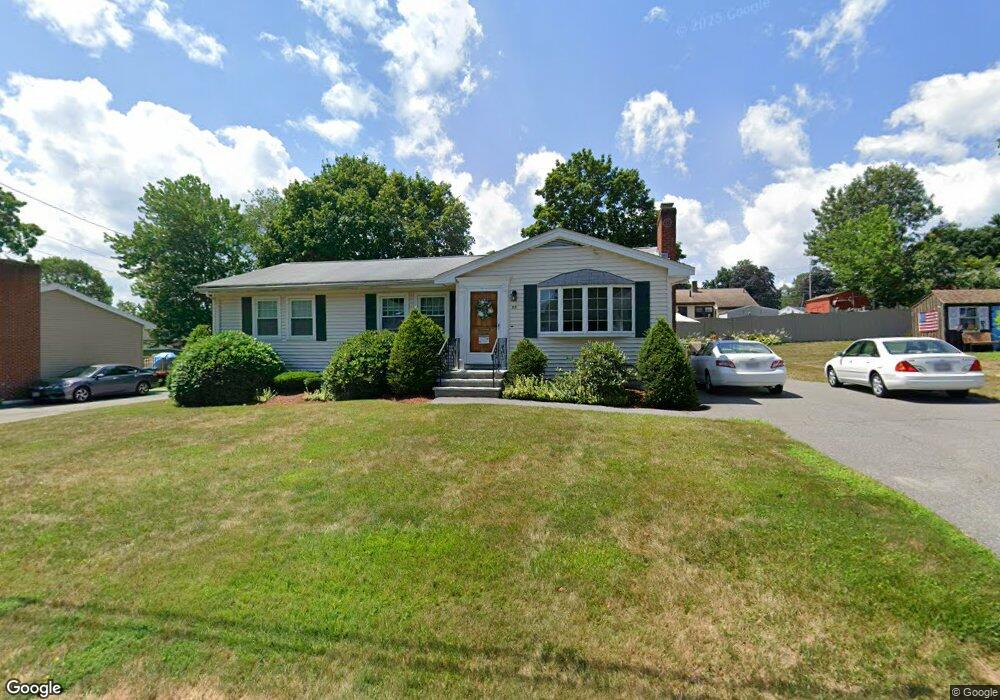
85 Dinsmore St Lowell, MA 01852
Belvidere NeighborhoodEstimated Value: $604,000 - $643,875
3
Beds
2
Baths
1,844
Sq Ft
$337/Sq Ft
Est. Value
About This Home
This home is located at 85 Dinsmore St, Lowell, MA 01852 and is currently estimated at $621,219, approximately $336 per square foot. 85 Dinsmore St is a home located in Middlesex County with nearby schools including Moody Elementary School, Abraham Lincoln Elementary School, and Greenhalge Elementary School.
Ownership History
Date
Name
Owned For
Owner Type
Purchase Details
Closed on
Aug 1, 1966
Bought by
Ahearn Francis W and Ahearn Barbara J
Current Estimated Value
Create a Home Valuation Report for This Property
The Home Valuation Report is an in-depth analysis detailing your home's value as well as a comparison with similar homes in the area
Home Values in the Area
Average Home Value in this Area
Purchase History
We collect this data history from publicly available records. To have your information removed, we recommend requesting removal directly through your county’s website.
| Date | Buyer | Sale Price | Title Company |
|---|---|---|---|
| Ahearn Francis W | $18,000 | -- |
Source: Public Records
Mortgage History
We collect this data history from publicly available records. To have your information removed, we recommend requesting removal directly through your county’s website.
| Date | Status | Borrower | Loan Amount |
|---|---|---|---|
| Open | Ahearn Francis W | $40,000 | |
| Closed | Ahearn Francis W | $30,000 | |
| Closed | Ahearn Francis W | $30,000 |
Source: Public Records
Tax History
| Year | Tax Paid | Tax Assessment Tax Assessment Total Assessment is a certain percentage of the fair market value that is determined by local assessors to be the total taxable value of land and additions on the property. | Land | Improvement |
|---|---|---|---|---|
| 2025 | $6,455 | $562,300 | $222,600 | $339,700 |
| 2024 | $6,004 | $504,100 | $200,300 | $303,800 |
| 2023 | $5,722 | $460,700 | $174,200 | $286,500 |
| 2022 | $5,217 | $411,100 | $153,500 | $257,600 |
| 2021 | $5,210 | $387,100 | $133,600 | $253,500 |
| 2020 | $4,788 | $358,400 | $133,600 | $224,800 |
| 2019 | $4,920 | $350,400 | $127,600 | $222,800 |
| 2018 | $4,690 | $325,900 | $121,600 | $204,300 |
| 2017 | $4,460 | $298,900 | $108,000 | $190,900 |
| 2016 | $4,171 | $275,100 | $99,600 | $175,500 |
| 2015 | $4,187 | $270,500 | $99,600 | $170,900 |
| 2013 | $3,916 | $260,900 | $118,300 | $142,600 |
Source: Public Records
Map
Nearby Homes
- 25 Windward Rd
- 471 Butman Rd
- 87 Dancause Rd
- 588 Andover St
- 18 Nob Way
- 54 Wentworth Ave
- 21 Guild St
- 105 Starr Ave
- 36 Glenn Rd
- 35 Burnham Rd
- 105 Stafford Rd
- 58 Brunswick St
- 273 Rogers St
- 317 Nesmith St
- 333 First Street Blvd Unit 209
- 62 Huntington St
- 100 Roper St Unit D
- 116 Fort Hill Ave
- 357 Boylston St Unit 5
- 357 Boylston St Unit 3
- 77 Dinsmore St
- 93 Dinsmore St
- 112 Enfield St
- 120 Enfield St
- 104 Enfield St
- 78 Dinsmore St
- 101 Dinsmore St
- 94 Dinsmore St
- 67 Dinsmore St
- 136 Glenmere St
- 96 Enfield St
- 68 Dinsmore St
- 110 Glenmere St
- 152 Glenmere St
- 104 Dinsmore St
- 291 Douglas Rd
- 101 Enfield St
- 88 Enfield St
- 275 Douglas Rd
- 60 Dinsmore St
Your Personal Tour Guide
Ask me questions while you tour the home.