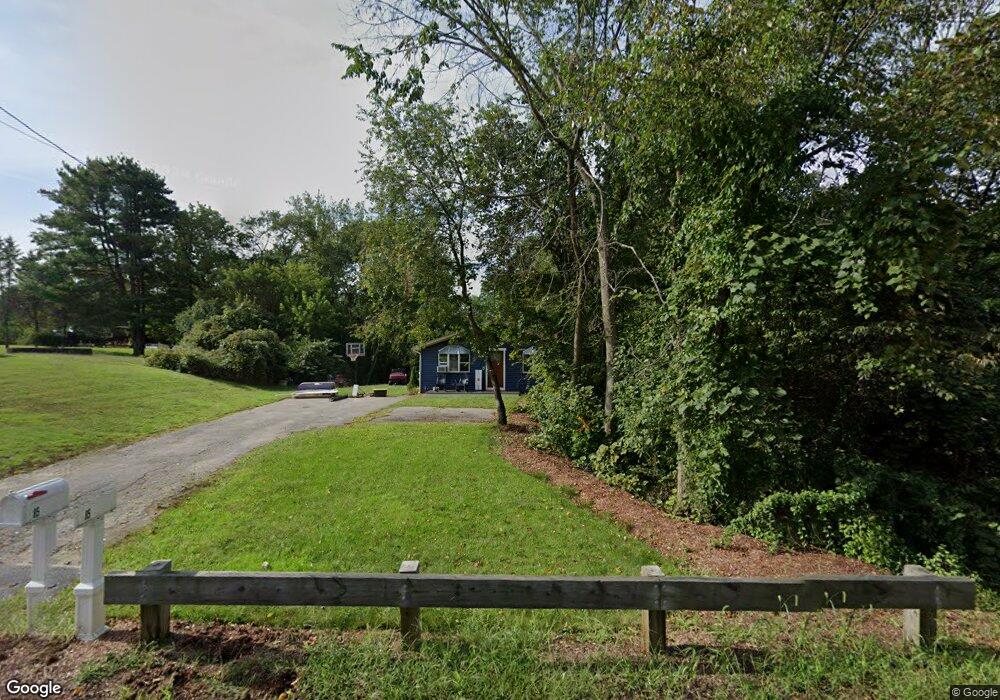
85 Elm St Blackstone, MA 01504
Estimated Value: $302,000 - $423,000
3
Beds
1
Bath
1,064
Sq Ft
$363/Sq Ft
Est. Value
About This Home
This home is located at 85 Elm St, Blackstone, MA 01504 and is currently estimated at $386,703, approximately $363 per square foot. 85 Elm St is a home located in Worcester County with nearby schools including Blackstone-Millville Regional High School, Rise Prep Mayoral Academy Middle School, and Rise Prep Mayoral Academy.
Ownership History
Date
Name
Owned For
Owner Type
Purchase Details
Closed on
Nov 20, 2019
Sold by
Daprato Alfred
Bought by
Stamant Jacob W and Dube Darcie L
Current Estimated Value
Home Financials for this Owner
Home Financials are based on the most recent Mortgage that was taken out on this home.
Original Mortgage
$226,442
Outstanding Balance
$198,812
Interest Rate
3.5%
Mortgage Type
New Conventional
Estimated Equity
$187,891
Purchase Details
Closed on
Aug 2, 2019
Sold by
Martel Joseph and Us Bank Na
Bought by
Daprato Alfred
Purchase Details
Closed on
Jul 26, 2018
Sold by
Martel Joseph
Bought by
Us Bank Na Tr
Purchase Details
Closed on
Feb 24, 2004
Sold by
Cornell Bernard R
Bought by
Martel Joseph L
Home Financials for this Owner
Home Financials are based on the most recent Mortgage that was taken out on this home.
Original Mortgage
$160,000
Interest Rate
5.83%
Mortgage Type
Purchase Money Mortgage
Create a Home Valuation Report for This Property
The Home Valuation Report is an in-depth analysis detailing your home's value as well as a comparison with similar homes in the area
Home Values in the Area
Average Home Value in this Area
Purchase History
| Date | Buyer | Sale Price | Title Company |
|---|---|---|---|
| Stamant Jacob W | $190,000 | -- | |
| Daprato Alfred | $160,000 | -- | |
| Us Bank Na Tr | $212,500 | -- | |
| Martel Joseph L | $215,000 | -- |
Source: Public Records
Mortgage History
| Date | Status | Borrower | Loan Amount |
|---|---|---|---|
| Open | Stamant Jacob W | $226,442 | |
| Previous Owner | Martel Joseph L | $160,000 |
Source: Public Records
Tax History
| Year | Tax Paid | Tax Assessment Tax Assessment Total Assessment is a certain percentage of the fair market value that is determined by local assessors to be the total taxable value of land and additions on the property. | Land | Improvement |
|---|---|---|---|---|
| 2025 | $5,241 | $347,100 | $168,000 | $179,100 |
| 2024 | $5,586 | $342,100 | $168,000 | $174,100 |
| 2023 | $5,145 | $318,000 | $168,000 | $150,000 |
| 2022 | $5,311 | $296,700 | $160,400 | $136,300 |
| 2021 | $4,886 | $261,000 | $145,800 | $115,200 |
| 2020 | $4,785 | $253,700 | $145,800 | $107,900 |
| 2019 | $4,512 | $238,600 | $134,000 | $104,600 |
| 2018 | $4,218 | $216,400 | $127,500 | $88,900 |
| 2017 | $4,181 | $217,100 | $127,500 | $89,600 |
| 2016 | $4,185 | $216,400 | $118,800 | $97,600 |
| 2015 | $4,019 | $206,300 | $118,800 | $87,500 |
Source: Public Records
Map
Nearby Homes
- 11 Bellingham Rd
- Lot 3 Pickering Rd
- Lot 2 Pickering Rd
- Lot 1 Pickering Rd
- Lot 4 Pickering Rd
- Lot 5 Pickering Rd
- 14 Little Tree Ln
- 22 Fox Run Rd
- 70 Oswego St
- 183 Elm St Unit 185
- 60 Freeman St
- 11 Quail Run Rd
- 90 Pleasant St
- 36 Indian Run Rd
- 5 Bernier Ln
- 162 Blackstone St
- 40 Valley St
- 21 Irving St
- 1, 3, 5 Old Lincoln St
- 101 Pine Grove Ave
Your Personal Tour Guide
Ask me questions while you tour the home.