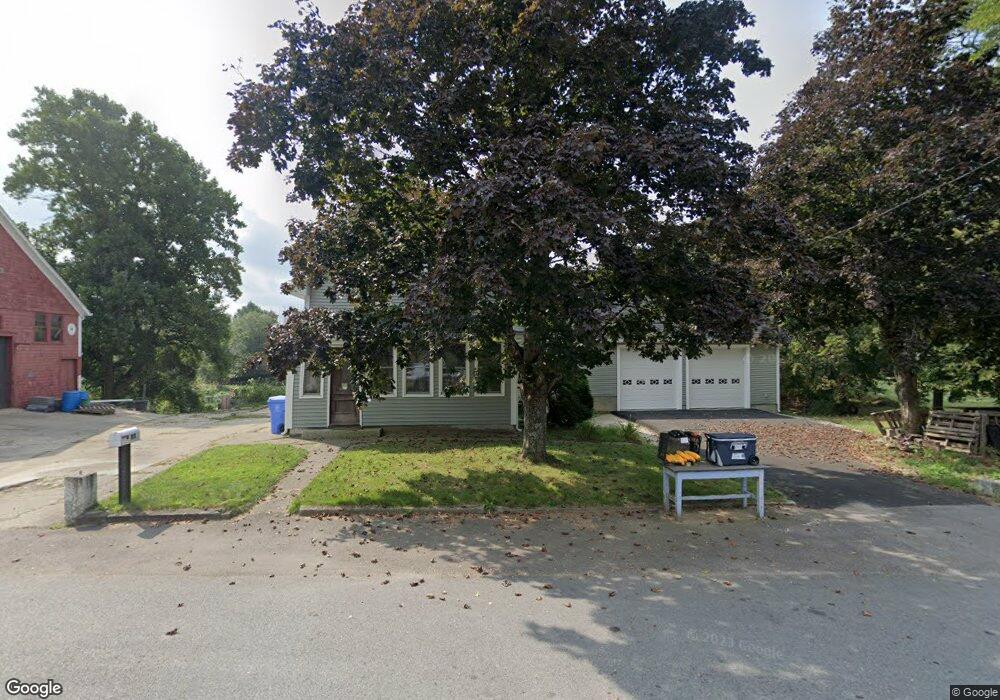
85 Fisher St Holliston, MA 01746
Estimated Value: $712,000 - $928,000
3
Beds
5
Baths
2,110
Sq Ft
$379/Sq Ft
Est. Value
About This Home
This home is located at 85 Fisher St, Holliston, MA 01746 and is currently estimated at $799,156, approximately $378 per square foot. 85 Fisher St is a home located in Middlesex County with nearby schools including Miller Elementary School, Robert H. Adams Middle School, and Holliston High School.
Ownership History
Date
Name
Owned For
Owner Type
Purchase Details
Closed on
Mar 30, 2022
Sold by
Kampersal Mark F
Bought by
Kampersal Mark F and Kampersal Heidi L
Current Estimated Value
Home Financials for this Owner
Home Financials are based on the most recent Mortgage that was taken out on this home.
Original Mortgage
$407,000
Outstanding Balance
$382,981
Interest Rate
4.42%
Mortgage Type
Stand Alone Refi Refinance Of Original Loan
Estimated Equity
$416,175
Purchase Details
Closed on
Dec 29, 2015
Sold by
Kampersal Kerry E
Bought by
Kampersal Mark F
Purchase Details
Closed on
Feb 14, 2013
Sold by
Kampersal Alfred E A E and Gouveia Bonnie L
Bought by
Kampersal Kerry E
Create a Home Valuation Report for This Property
The Home Valuation Report is an in-depth analysis detailing your home's value as well as a comparison with similar homes in the area
Home Values in the Area
Average Home Value in this Area
Purchase History
| Date | Buyer | Sale Price | Title Company |
|---|---|---|---|
| Kampersal Mark F | -- | None Available | |
| Kampersal Mark F | -- | None Available | |
| Kampersal Mark F | -- | -- | |
| Kampersal Kerry E | -- | -- | |
| Kampersal Mark F | -- | -- | |
| Kampersal Kerry E | -- | -- |
Source: Public Records
Mortgage History
| Date | Status | Borrower | Loan Amount |
|---|---|---|---|
| Open | Kampersal Mark F | $407,000 | |
| Closed | Kampersal Mark F | $407,000 |
Source: Public Records
Tax History Compared to Growth
Tax History
| Year | Tax Paid | Tax Assessment Tax Assessment Total Assessment is a certain percentage of the fair market value that is determined by local assessors to be the total taxable value of land and additions on the property. | Land | Improvement |
|---|---|---|---|---|
| 2025 | $9,946 | $678,900 | $262,300 | $416,600 |
| 2024 | $8,884 | $589,900 | $262,300 | $327,600 |
| 2023 | $6,337 | $411,500 | $262,300 | $149,200 |
| 2022 | $6,622 | $381,000 | $262,300 | $118,700 |
| 2021 | $6,517 | $365,100 | $250,300 | $114,800 |
| 2020 | $6,963 | $369,400 | $276,700 | $92,700 |
| 2019 | $6,338 | $336,600 | $235,900 | $100,700 |
| 2018 | $6,284 | $336,600 | $235,900 | $100,700 |
| 2017 | $5,839 | $315,300 | $227,100 | $88,200 |
| 2016 | $5,654 | $300,900 | $212,700 | $88,200 |
| 2015 | $5,211 | $268,900 | $179,900 | $89,000 |
Source: Public Records
Map
Nearby Homes
- 85 Fisher St
- 78 Fisher St
- 4 Deerfield Rd
- 6 Rainbow Dr
- 56 Paul Rd
- 190-194 E Main St
- 22 Granite St
- 4 E Charles St
- 9 Tulip Way
- 12 Longmeadow Ln
- 39 West St
- 15 Free St
- Lot 1 Florence St
- 35 Woodland Ave Unit 35A
- 6 Freedom Trail
- 17 Middleton St
- 11 Black Bear Unit 11
- 9 Black Bear Cir Unit 9
- 7 Black Bear Unit 7
- 43 Black Bear Cir Unit 43