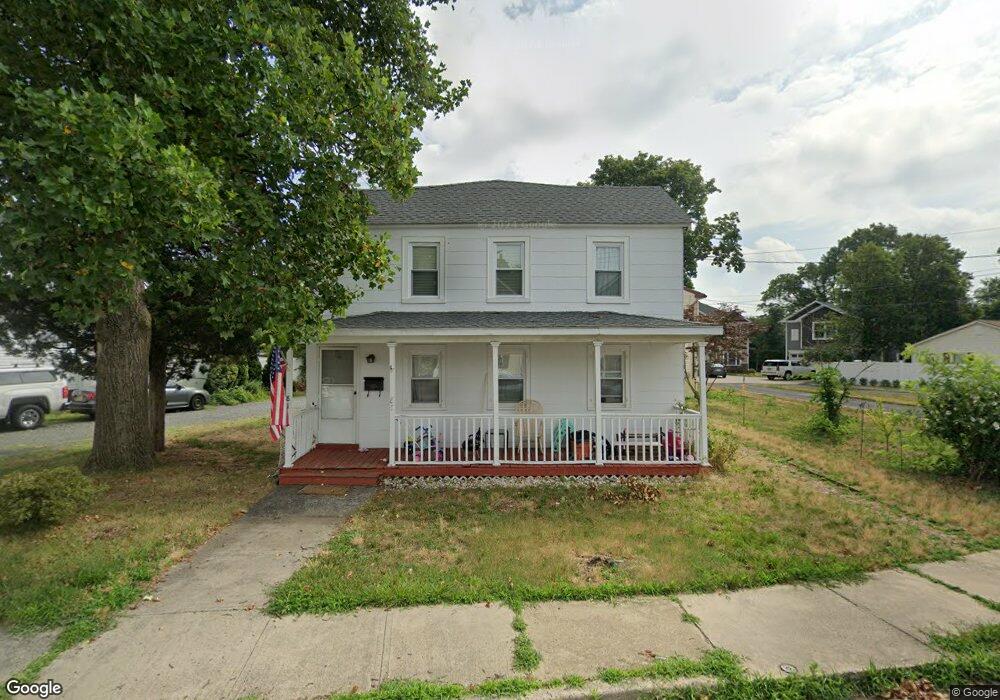
85 Fulton St Keyport, NJ 07735
Estimated Value: $504,000 - $584,000
3
Beds
2
Baths
1,880
Sq Ft
$295/Sq Ft
Est. Value
About This Home
This home is located at 85 Fulton St, Keyport, NJ 07735 and is currently estimated at $554,906, approximately $295 per square foot. 85 Fulton St is a home located in Monmouth County with nearby schools including Keyport Central School, Keyport High School, and Icob Academy.
Ownership History
Date
Name
Owned For
Owner Type
Purchase Details
Closed on
Oct 23, 2023
Sold by
Poling Richard W
Bought by
81-85 Fulton St Llc
Current Estimated Value
Purchase Details
Closed on
Oct 23, 2012
Sold by
Pling Richard W and Estate Of Theresa Poling
Bought by
Poling Richard W and Theresa Poling Family Trust
Purchase Details
Closed on
Jul 3, 2007
Sold by
Poling Richard W and Poling Theresa
Bought by
Poling Richard W and Poling Theresa
Create a Home Valuation Report for This Property
The Home Valuation Report is an in-depth analysis detailing your home's value as well as a comparison with similar homes in the area
Home Values in the Area
Average Home Value in this Area
Purchase History
| Date | Buyer | Sale Price | Title Company |
|---|---|---|---|
| 81-85 Fulton St Llc | $300,000 | Stewart Title | |
| 81-85 Fulton St Llc | $300,000 | Stewart Title | |
| Poling Richard W | -- | None Available | |
| Poling Richard W | -- | None Available | |
| Poling Richard W | -- | None Available |
Source: Public Records
Tax History Compared to Growth
Tax History
| Year | Tax Paid | Tax Assessment Tax Assessment Total Assessment is a certain percentage of the fair market value that is determined by local assessors to be the total taxable value of land and additions on the property. | Land | Improvement |
|---|---|---|---|---|
| 2025 | $9,160 | $486,100 | $241,400 | $244,700 |
| 2024 | $8,838 | $442,500 | $209,900 | $232,600 |
| 2023 | $8,838 | $402,100 | $182,500 | $219,600 |
| 2022 | $7,130 | $349,600 | $158,700 | $190,900 |
| 2021 | $7,130 | $300,800 | $130,300 | $170,500 |
| 2020 | $7,331 | $288,300 | $126,100 | $162,200 |
| 2019 | $6,540 | $257,600 | $98,600 | $159,000 |
| 2018 | $6,432 | $247,400 | $98,600 | $148,800 |
| 2017 | $6,497 | $249,200 | $102,300 | $146,900 |
| 2016 | $6,251 | $241,800 | $102,300 | $139,500 |
| 2015 | $5,850 | $234,900 | $97,300 | $137,600 |
| 2014 | $6,067 | $245,600 | $72,300 | $173,300 |
Source: Public Records
Map
Nearby Homes