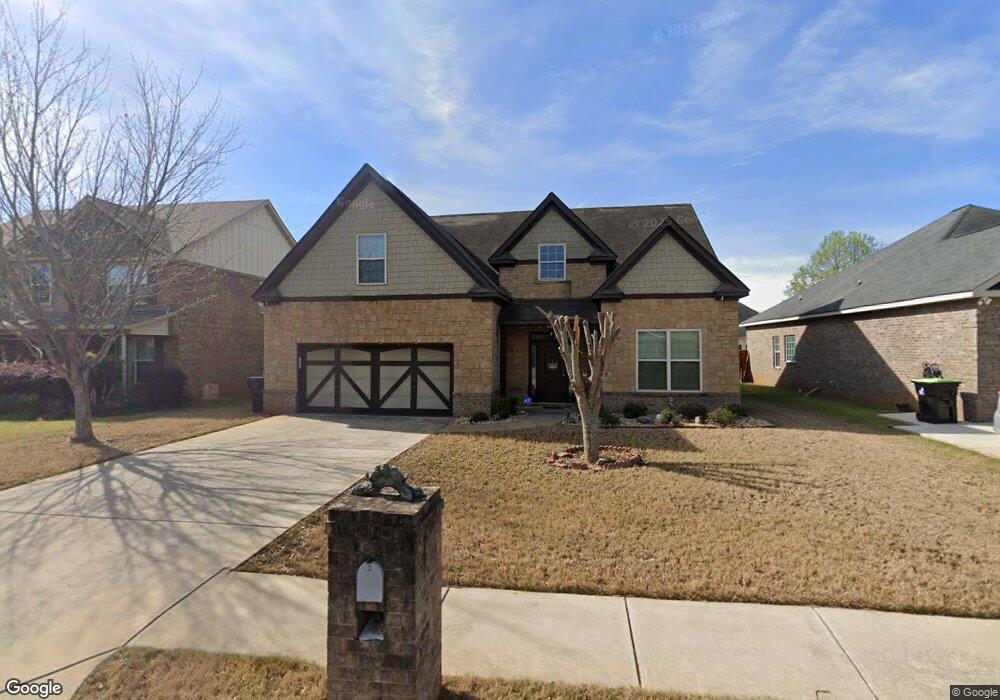
85 Glen Arbor Ln Warner Robins, GA 31088
Estimated Value: $326,000 - $350,000
4
Beds
3
Baths
2,571
Sq Ft
$131/Sq Ft
Est. Value
About This Home
This home is located at 85 Glen Arbor Ln, Warner Robins, GA 31088 and is currently estimated at $336,215, approximately $130 per square foot. 85 Glen Arbor Ln is a home located in Houston County with nearby schools including Lake Joy Primary School, Lake Joy Elementary School, and Feagin Mill Middle School.
Ownership History
Date
Name
Owned For
Owner Type
Purchase Details
Closed on
Aug 14, 2019
Sold by
Kelly Matthew J and Kelly Candice
Bought by
Soni Vulinabahen and Patel Kalpesh A
Current Estimated Value
Home Financials for this Owner
Home Financials are based on the most recent Mortgage that was taken out on this home.
Original Mortgage
$209,000
Outstanding Balance
$183,045
Interest Rate
3.7%
Mortgage Type
New Conventional
Estimated Equity
$153,170
Purchase Details
Closed on
Oct 11, 2013
Sold by
Kelly Matthew J
Bought by
Kelly Matthew J and Kelly Candice
Home Financials for this Owner
Home Financials are based on the most recent Mortgage that was taken out on this home.
Original Mortgage
$194,085
Interest Rate
4.57%
Mortgage Type
VA
Purchase Details
Closed on
Oct 1, 2012
Sold by
41 Development Llc
Bought by
Edgar Hughston Builder Inc
Home Financials for this Owner
Home Financials are based on the most recent Mortgage that was taken out on this home.
Original Mortgage
$152,250
Interest Rate
3.64%
Mortgage Type
Construction
Create a Home Valuation Report for This Property
The Home Valuation Report is an in-depth analysis detailing your home's value as well as a comparison with similar homes in the area
Home Values in the Area
Average Home Value in this Area
Purchase History
| Date | Buyer | Sale Price | Title Company |
|---|---|---|---|
| Soni Vulinabahen | $220,000 | None Available | |
| Kelly Matthew J | -- | -- | |
| Kelly Matthew J | $190,000 | -- | |
| Edgar Hughston Builder Inc | $72,000 | None Available |
Source: Public Records
Mortgage History
| Date | Status | Borrower | Loan Amount |
|---|---|---|---|
| Open | Soni Vulinabahen | $209,000 | |
| Previous Owner | Kelly Matthew J | $194,085 | |
| Previous Owner | Edgar Hughston Builder Inc | $152,250 |
Source: Public Records
Tax History Compared to Growth
Tax History
| Year | Tax Paid | Tax Assessment Tax Assessment Total Assessment is a certain percentage of the fair market value that is determined by local assessors to be the total taxable value of land and additions on the property. | Land | Improvement |
|---|---|---|---|---|
| 2024 | $3,555 | $108,640 | $10,000 | $98,640 |
| 2023 | $3,446 | $104,520 | $10,000 | $94,520 |
| 2022 | $2,111 | $91,800 | $10,000 | $81,800 |
| 2021 | $1,812 | $78,360 | $10,000 | $68,360 |
| 2020 | $1,820 | $78,360 | $10,000 | $68,360 |
| 2019 | $1,619 | $69,680 | $10,000 | $59,680 |
| 2018 | $1,619 | $69,680 | $10,000 | $59,680 |
| 2017 | $1,620 | $69,680 | $10,000 | $59,680 |
| 2016 | $1,623 | $69,680 | $10,000 | $59,680 |
| 2015 | -- | $69,680 | $10,000 | $59,680 |
| 2014 | -- | $69,680 | $10,000 | $59,680 |
| 2013 | -- | $69,680 | $10,000 | $59,680 |
Source: Public Records
Map
Nearby Homes
- 85 Glen Arbor Lane (28 E)
- 83 Glen Arbor Ln Unit 83 Glen Arbor ln
- 83 Glen Arbor (Lt27e)
- 87 Glen Arbor Ln
- 89 Glen Arbor Ln
- 81 Glen Arbor Ln
- 81 Glen Arbor Ln (Lt26e)
- 621 Post Oak Way
- 619 Post Oak Way
- 623 Post Oak Way
- 617 Post Oak Way
- 84 Glen Arbor Ln
- 82 Glen Arbor Ln
- 86 Glen Arbor Ln
- 91 Glen Arbor Ln
- 625 Post Oak Way
- 80 Glen Arbor Ln
- 79 Glen Arbor Ln
- 79 Glen Arbor Ln (Lt25e)
- 88 Glen Arbor Ln