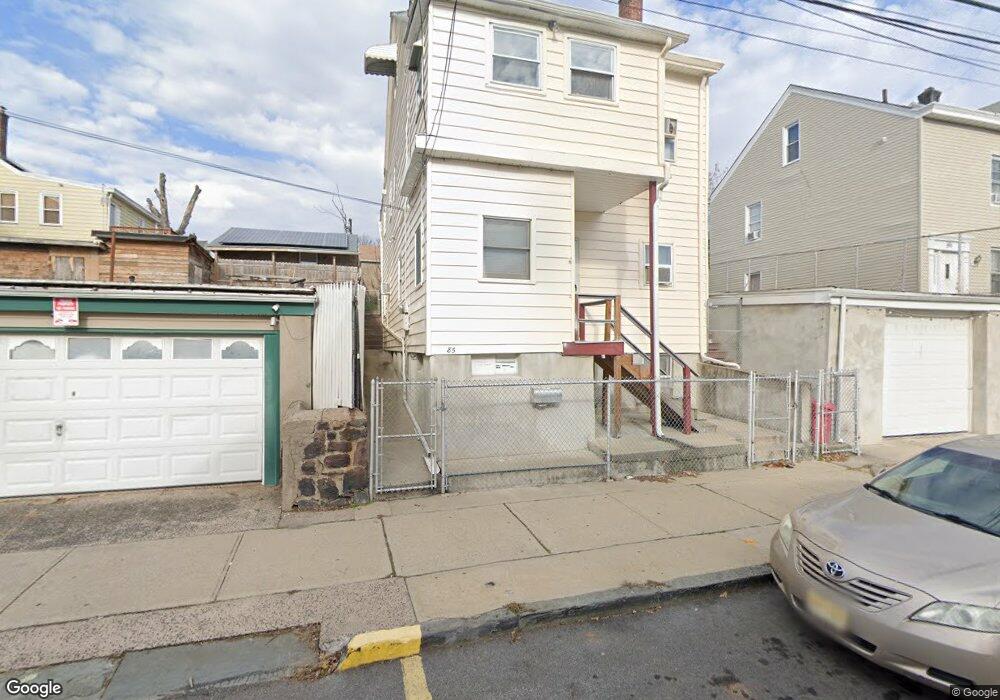
85 Hopper St Unit 2 Prospect Park, NJ 07508
Estimated Value: $581,371 - $655,000
3
Beds
2
Baths
2,371
Sq Ft
$261/Sq Ft
Est. Value
About This Home
This home is located at 85 Hopper St Unit 2, Prospect Park, NJ 07508 and is currently estimated at $617,843, approximately $260 per square foot. 85 Hopper St Unit 2 is a home located in Passaic County with nearby schools including Number 1, Prospect Park Elementary School, Manchester Reg High School, and Al-Hikmah Elementary School.
Ownership History
Date
Name
Owned For
Owner Type
Purchase Details
Closed on
Mar 31, 2022
Sold by
Burgaleta Family Trust
Bought by
Cordova Jorge D Morante and Guzman Joanna L
Current Estimated Value
Home Financials for this Owner
Home Financials are based on the most recent Mortgage that was taken out on this home.
Original Mortgage
$347,985
Outstanding Balance
$328,278
Interest Rate
4.67%
Mortgage Type
New Conventional
Estimated Equity
$289,565
Purchase Details
Closed on
Jun 19, 2018
Sold by
Burgaleta Juan E and Burgaleta Maria
Bought by
Burgaleta Parella Ana Maria and Burgaleta Family Trust
Create a Home Valuation Report for This Property
The Home Valuation Report is an in-depth analysis detailing your home's value as well as a comparison with similar homes in the area
Home Values in the Area
Average Home Value in this Area
Purchase History
| Date | Buyer | Sale Price | Title Company |
|---|---|---|---|
| Cordova Jorge D Morante | $360,000 | New Title Company Name | |
| Burgaleta Parella Ana Maria | -- | None Available | |
| Burgaleta Parella Ana Maria | -- | None Available |
Source: Public Records
Mortgage History
| Date | Status | Borrower | Loan Amount |
|---|---|---|---|
| Open | Cordova Jorge D Morante | $347,985 |
Source: Public Records
Tax History Compared to Growth
Tax History
| Year | Tax Paid | Tax Assessment Tax Assessment Total Assessment is a certain percentage of the fair market value that is determined by local assessors to be the total taxable value of land and additions on the property. | Land | Improvement |
|---|---|---|---|---|
| 2025 | $12,717 | $213,700 | $41,100 | $172,600 |
| 2024 | $11,801 | $213,700 | $41,100 | $172,600 |
| 2022 | $11,674 | $213,700 | $41,100 | $172,600 |
| 2021 | $11,542 | $213,700 | $41,100 | $172,600 |
| 2020 | $11,177 | $213,700 | $41,100 | $172,600 |
| 2019 | $11,061 | $213,700 | $41,100 | $172,600 |
| 2018 | $10,952 | $213,700 | $41,100 | $172,600 |
| 2017 | $10,798 | $213,700 | $41,100 | $172,600 |
| 2016 | $10,657 | $213,700 | $41,100 | $172,600 |
| 2015 | $10,078 | $213,700 | $41,100 | $172,600 |
| 2014 | $8,312 | $125,900 | $25,500 | $100,400 |
Source: Public Records
Map
Nearby Homes