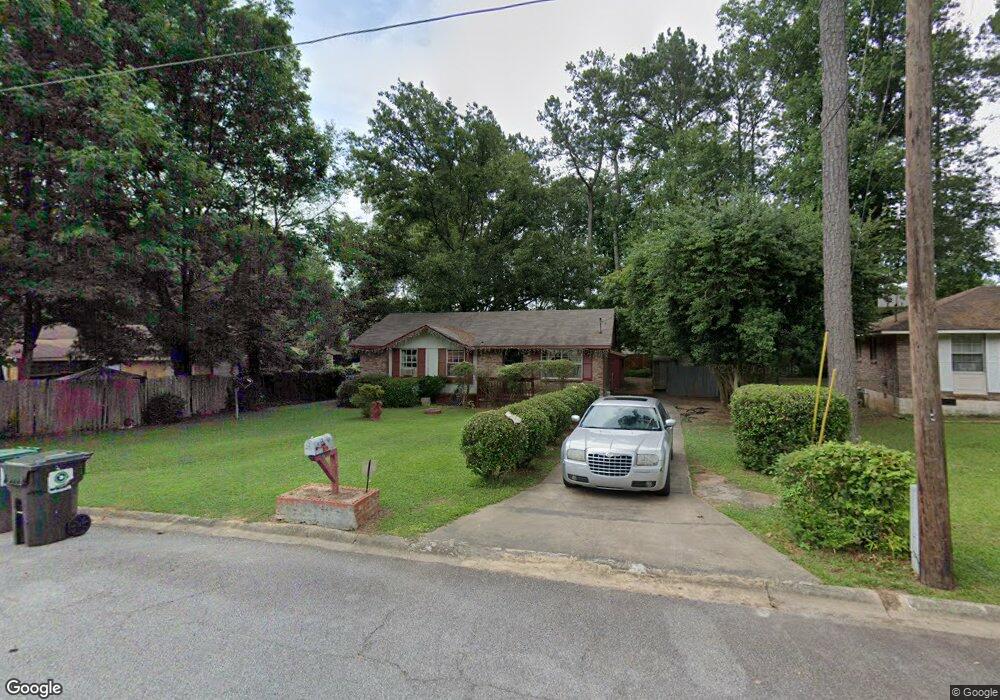
85 Libby Ln Unit 5 Jonesboro, GA 30238
Estimated Value: $165,264 - $188,000
3
Beds
1
Bath
1,040
Sq Ft
$171/Sq Ft
Est. Value
About This Home
This home is located at 85 Libby Ln Unit 5, Jonesboro, GA 30238 and is currently estimated at $178,316, approximately $171 per square foot. 85 Libby Ln Unit 5 is a home located in Clayton County with nearby schools including Swint Elementary School, Pointe South Middle School, and Mundy's Mill High School.
Ownership History
Date
Name
Owned For
Owner Type
Purchase Details
Closed on
Mar 31, 2006
Sold by
Harris Christopher B
Bought by
Nelson Patricia and Nelson Jamie
Current Estimated Value
Home Financials for this Owner
Home Financials are based on the most recent Mortgage that was taken out on this home.
Original Mortgage
$94,500
Outstanding Balance
$52,896
Interest Rate
6.2%
Mortgage Type
New Conventional
Estimated Equity
$125,420
Purchase Details
Closed on
Apr 24, 2002
Sold by
Nelson Jamie L
Bought by
Harris Christopher B
Home Financials for this Owner
Home Financials are based on the most recent Mortgage that was taken out on this home.
Original Mortgage
$86,000
Interest Rate
10%
Mortgage Type
New Conventional
Purchase Details
Closed on
Nov 15, 1994
Sold by
Turner James A
Bought by
Harris Christopher and Nelson Jamie L
Home Financials for this Owner
Home Financials are based on the most recent Mortgage that was taken out on this home.
Original Mortgage
$49,335
Interest Rate
8.82%
Mortgage Type
FHA
Create a Home Valuation Report for This Property
The Home Valuation Report is an in-depth analysis detailing your home's value as well as a comparison with similar homes in the area
Home Values in the Area
Average Home Value in this Area
Purchase History
| Date | Buyer | Sale Price | Title Company |
|---|---|---|---|
| Nelson Patricia | $94,500 | -- | |
| Harris Christopher B | -- | -- | |
| Harris Christopher | $49,900 | -- |
Source: Public Records
Mortgage History
| Date | Status | Borrower | Loan Amount |
|---|---|---|---|
| Open | Nelson Patricia | $94,500 | |
| Previous Owner | Harris Christopher B | $86,000 | |
| Previous Owner | Harris Christopher | $49,335 |
Source: Public Records
Tax History Compared to Growth
Tax History
| Year | Tax Paid | Tax Assessment Tax Assessment Total Assessment is a certain percentage of the fair market value that is determined by local assessors to be the total taxable value of land and additions on the property. | Land | Improvement |
|---|---|---|---|---|
| 2025 | $1,713 | $54,720 | $6,400 | $48,320 |
| 2024 | $1,601 | $51,040 | $6,400 | $44,640 |
| 2023 | $1,866 | $51,680 | $6,400 | $45,280 |
| 2022 | $0 | $36,320 | $6,400 | $29,920 |
| 2021 | $784 | $29,840 | $6,400 | $23,440 |
| 2020 | $567 | $24,165 | $6,400 | $17,765 |
| 2019 | $497 | $22,248 | $4,800 | $17,448 |
| 2018 | $407 | $20,036 | $4,800 | $15,236 |
| 2017 | $265 | $16,516 | $4,800 | $11,716 |
| 2016 | $218 | $15,348 | $4,800 | $10,548 |
| 2015 | $221 | $0 | $0 | $0 |
| 2014 | $230 | $15,762 | $5,600 | $10,162 |
Source: Public Records
Map
Nearby Homes
- 55 Royce Dr Unit 5
- 45 Royce Dr
- 37 Royce Dr Unit LOT 21
- 8356 Dunellen Ln
- 8344 Dunellen Ln
- 46 Royce Dr
- 8448 Taylor Rd
- 8265 Attleboro Dr
- 101 Woburn St
- 8317 Mountain Pass
- 8511 Pineland Dr
- 8207 Dunellen Ln
- 8567 Regent St
- 324 Cynthia Ct
- 8303 Taylor Rd
- 8238 Canyon Forge Dr
- 8117 Attleboro Dr
- 8236 Tudor Dr
- 110 Flint River Rd
- 1368 Riverstone Dr Unit 97
- 91 Libby Ln
- 79 Libby Ln Unit 5
- 8353 Regent St Unit LOT 77
- 8353 Regent St
- 8359 Regent St
- 8359 Regent St Unit LOT 76
- 8347 Regent St Unit LOT 78
- 8365 Regent St
- 8365 Regent St Unit LOT 75
- 71 Libby Ln
- 71 Libby Ln Unit 5
- 135 Libby Ln Unit 5
- 99 Libby Ln
- 8371 Regent St Unit LOT 74
- 8371 Regent St
- 8341 Regent St
- 84 Libby Ln
- 65 Libby Ln
- 76 Libby Ln
- 8377 Regent St