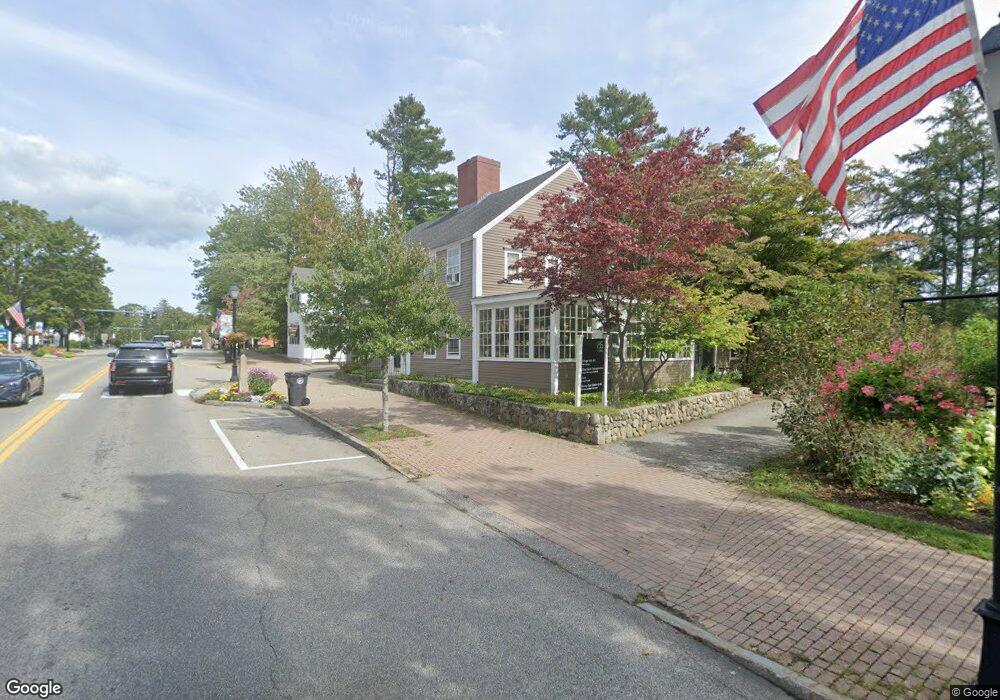
85 Main St Kennebunk, ME 04043
Estimated Value: $813,726
--
Bed
--
Bath
4,430
Sq Ft
$184/Sq Ft
Est. Value
About This Home
This home is located at 85 Main St, Kennebunk, ME 04043 and is currently estimated at $813,726, approximately $183 per square foot. 85 Main St is a home located in York County with nearby schools including Kennebunk High School, School Around Us, and The New School.
Ownership History
Date
Name
Owned For
Owner Type
Purchase Details
Closed on
Sep 1, 2022
Sold by
Snapdragon Prop Llc
Bought by
Mulligan On Main Llc
Current Estimated Value
Home Financials for this Owner
Home Financials are based on the most recent Mortgage that was taken out on this home.
Original Mortgage
$580,800
Outstanding Balance
$556,151
Interest Rate
5.54%
Mortgage Type
Purchase Money Mortgage
Estimated Equity
$257,575
Purchase Details
Closed on
Apr 5, 2006
Sold by
Corcoran Mgmt Co Inc
Bought by
Sanddragon Props Llc
Create a Home Valuation Report for This Property
The Home Valuation Report is an in-depth analysis detailing your home's value as well as a comparison with similar homes in the area
Home Values in the Area
Average Home Value in this Area
Purchase History
| Date | Buyer | Sale Price | Title Company |
|---|---|---|---|
| Mulligan On Main Llc | -- | None Available | |
| Sanddragon Props Llc | -- | -- |
Source: Public Records
Mortgage History
| Date | Status | Borrower | Loan Amount |
|---|---|---|---|
| Open | Mulligan On Main Llc | $580,800 |
Source: Public Records
Tax History Compared to Growth
Tax History
| Year | Tax Paid | Tax Assessment Tax Assessment Total Assessment is a certain percentage of the fair market value that is determined by local assessors to be the total taxable value of land and additions on the property. | Land | Improvement |
|---|---|---|---|---|
| 2024 | $9,321 | $549,900 | $312,300 | $237,600 |
| 2023 | $8,826 | $549,900 | $312,300 | $237,600 |
| 2022 | $8,029 | $549,900 | $312,300 | $237,600 |
| 2021 | $7,836 | $549,900 | $312,300 | $237,600 |
| 2020 | $7,781 | $549,900 | $312,300 | $237,600 |
| 2019 | $7,561 | $549,900 | $312,300 | $237,600 |
| 2018 | $7,217 | $412,400 | $234,200 | $178,200 |
| 2017 | $6,825 | $412,400 | $234,200 | $178,200 |
| 2016 | $6,557 | $412,400 | $234,200 | $178,200 |
| 2015 | $6,310 | $412,400 | $234,200 | $178,200 |
| 2014 | $6,145 | $412,400 | $234,200 | $178,200 |
Source: Public Records
Map
Nearby Homes
- 17 Water St Unit 9
- 22 York St
- 45 Summer St Unit 1
- 61 Fletcher St
- 30 York St Unit 1
- 14 Wiggins Pond Ln
- 47 Brown St
- 17 Legacy Ln
- 7 Acorn Cir
- 3 Hardwood Dr
- 31 Oakwood Ln
- 28 Longfellow Ln Unit 15
- 20 Wonderbrook Dr
- 7 Wonderbrook Dr
- 11 Mousam Ridge Rd
- 27 Webhannet Place Unit 16
- 18 Greenwich Way Unit 38
- 16 Boundary Way
- 00 Summer St
- 10 Intervale Rd
- 85 Main St
- 85 Main St Unit 6
- 93 Main St Unit 2
- 103 Main St
- 0 Fletcher St
- Unit 9 Nason
- 5 Dane St
- 7 Dane
- 1 Bourne St
- 84 Main St Unit 8
- 84 Main St Unit 9
- 84 Main St Unit 6
- 84 Main St Unit 7
- 84 Main St Unit 5
- 84 Main St Unit 3
- 84 Main St Unit 4
- 14 Fletcher St
- 76-84 Main St
- 5 Nasons Ct Unit 13
- 5 Nasons Ct Unit 8